
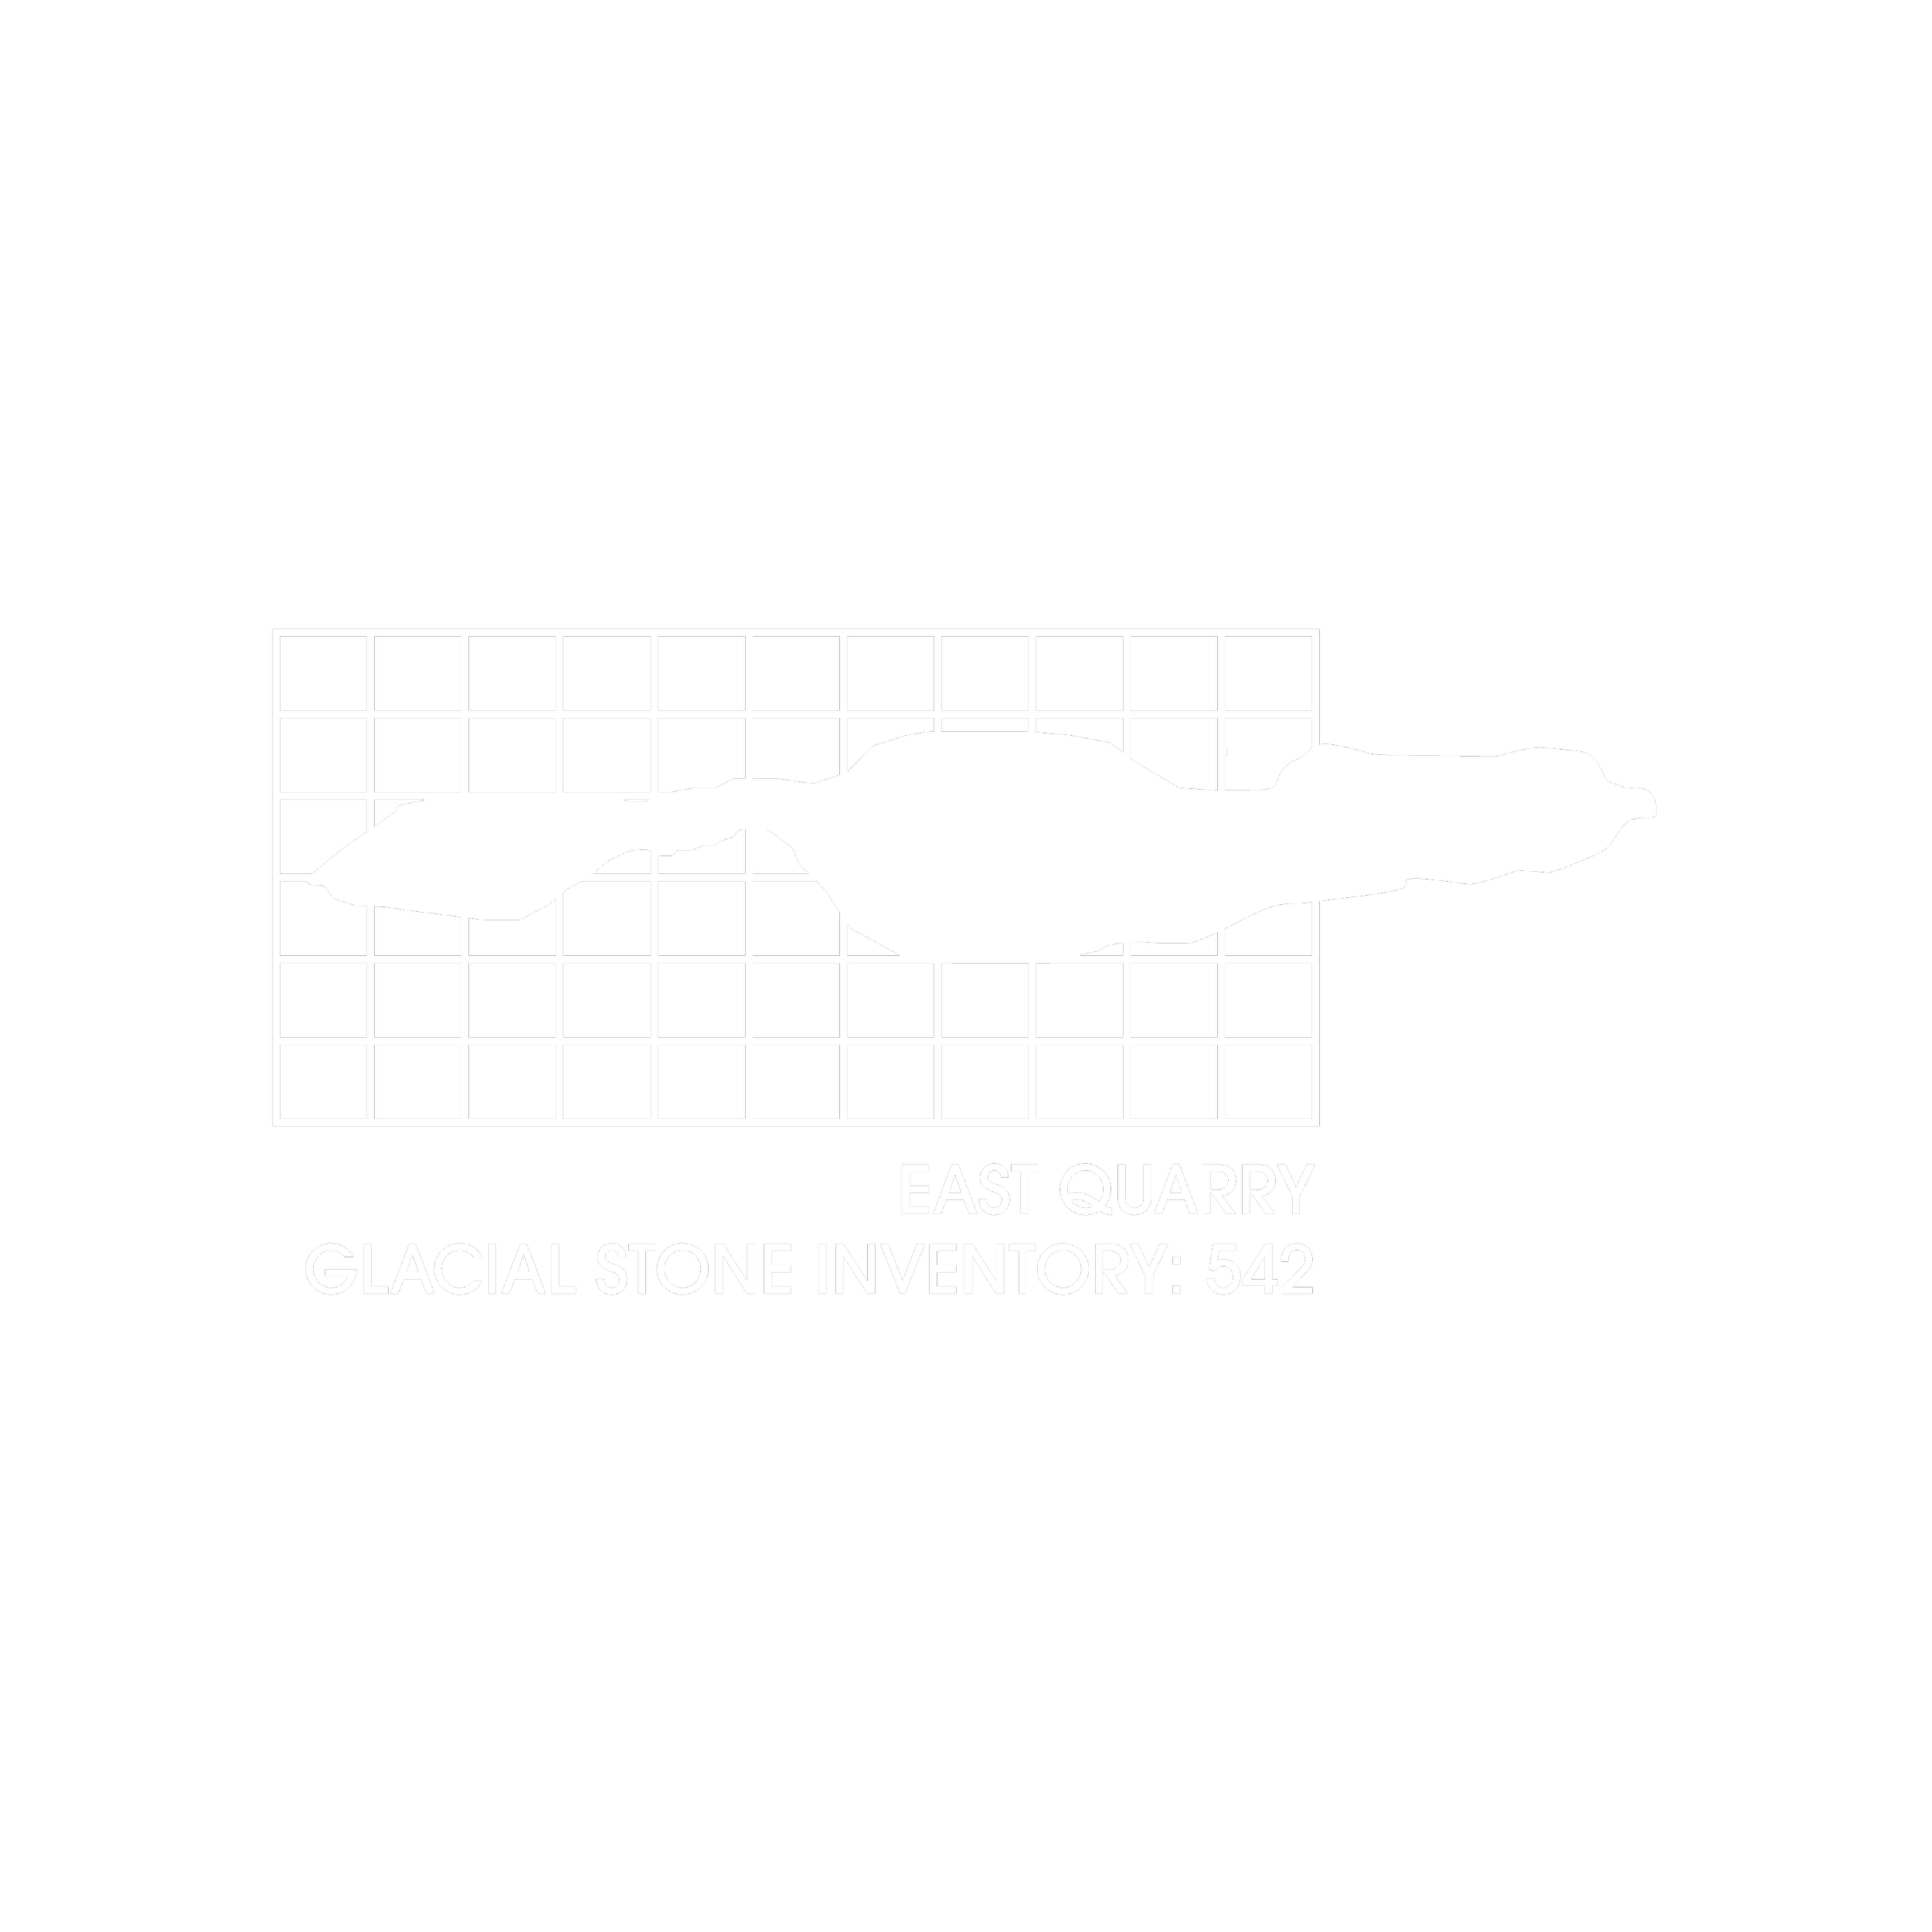
Glacial Stone Inventory
Forensic Landscape Analysis and Structural Mapping Operations
Kelleys Island, Lake Erie Archipelago, Ohio | 2023–2024
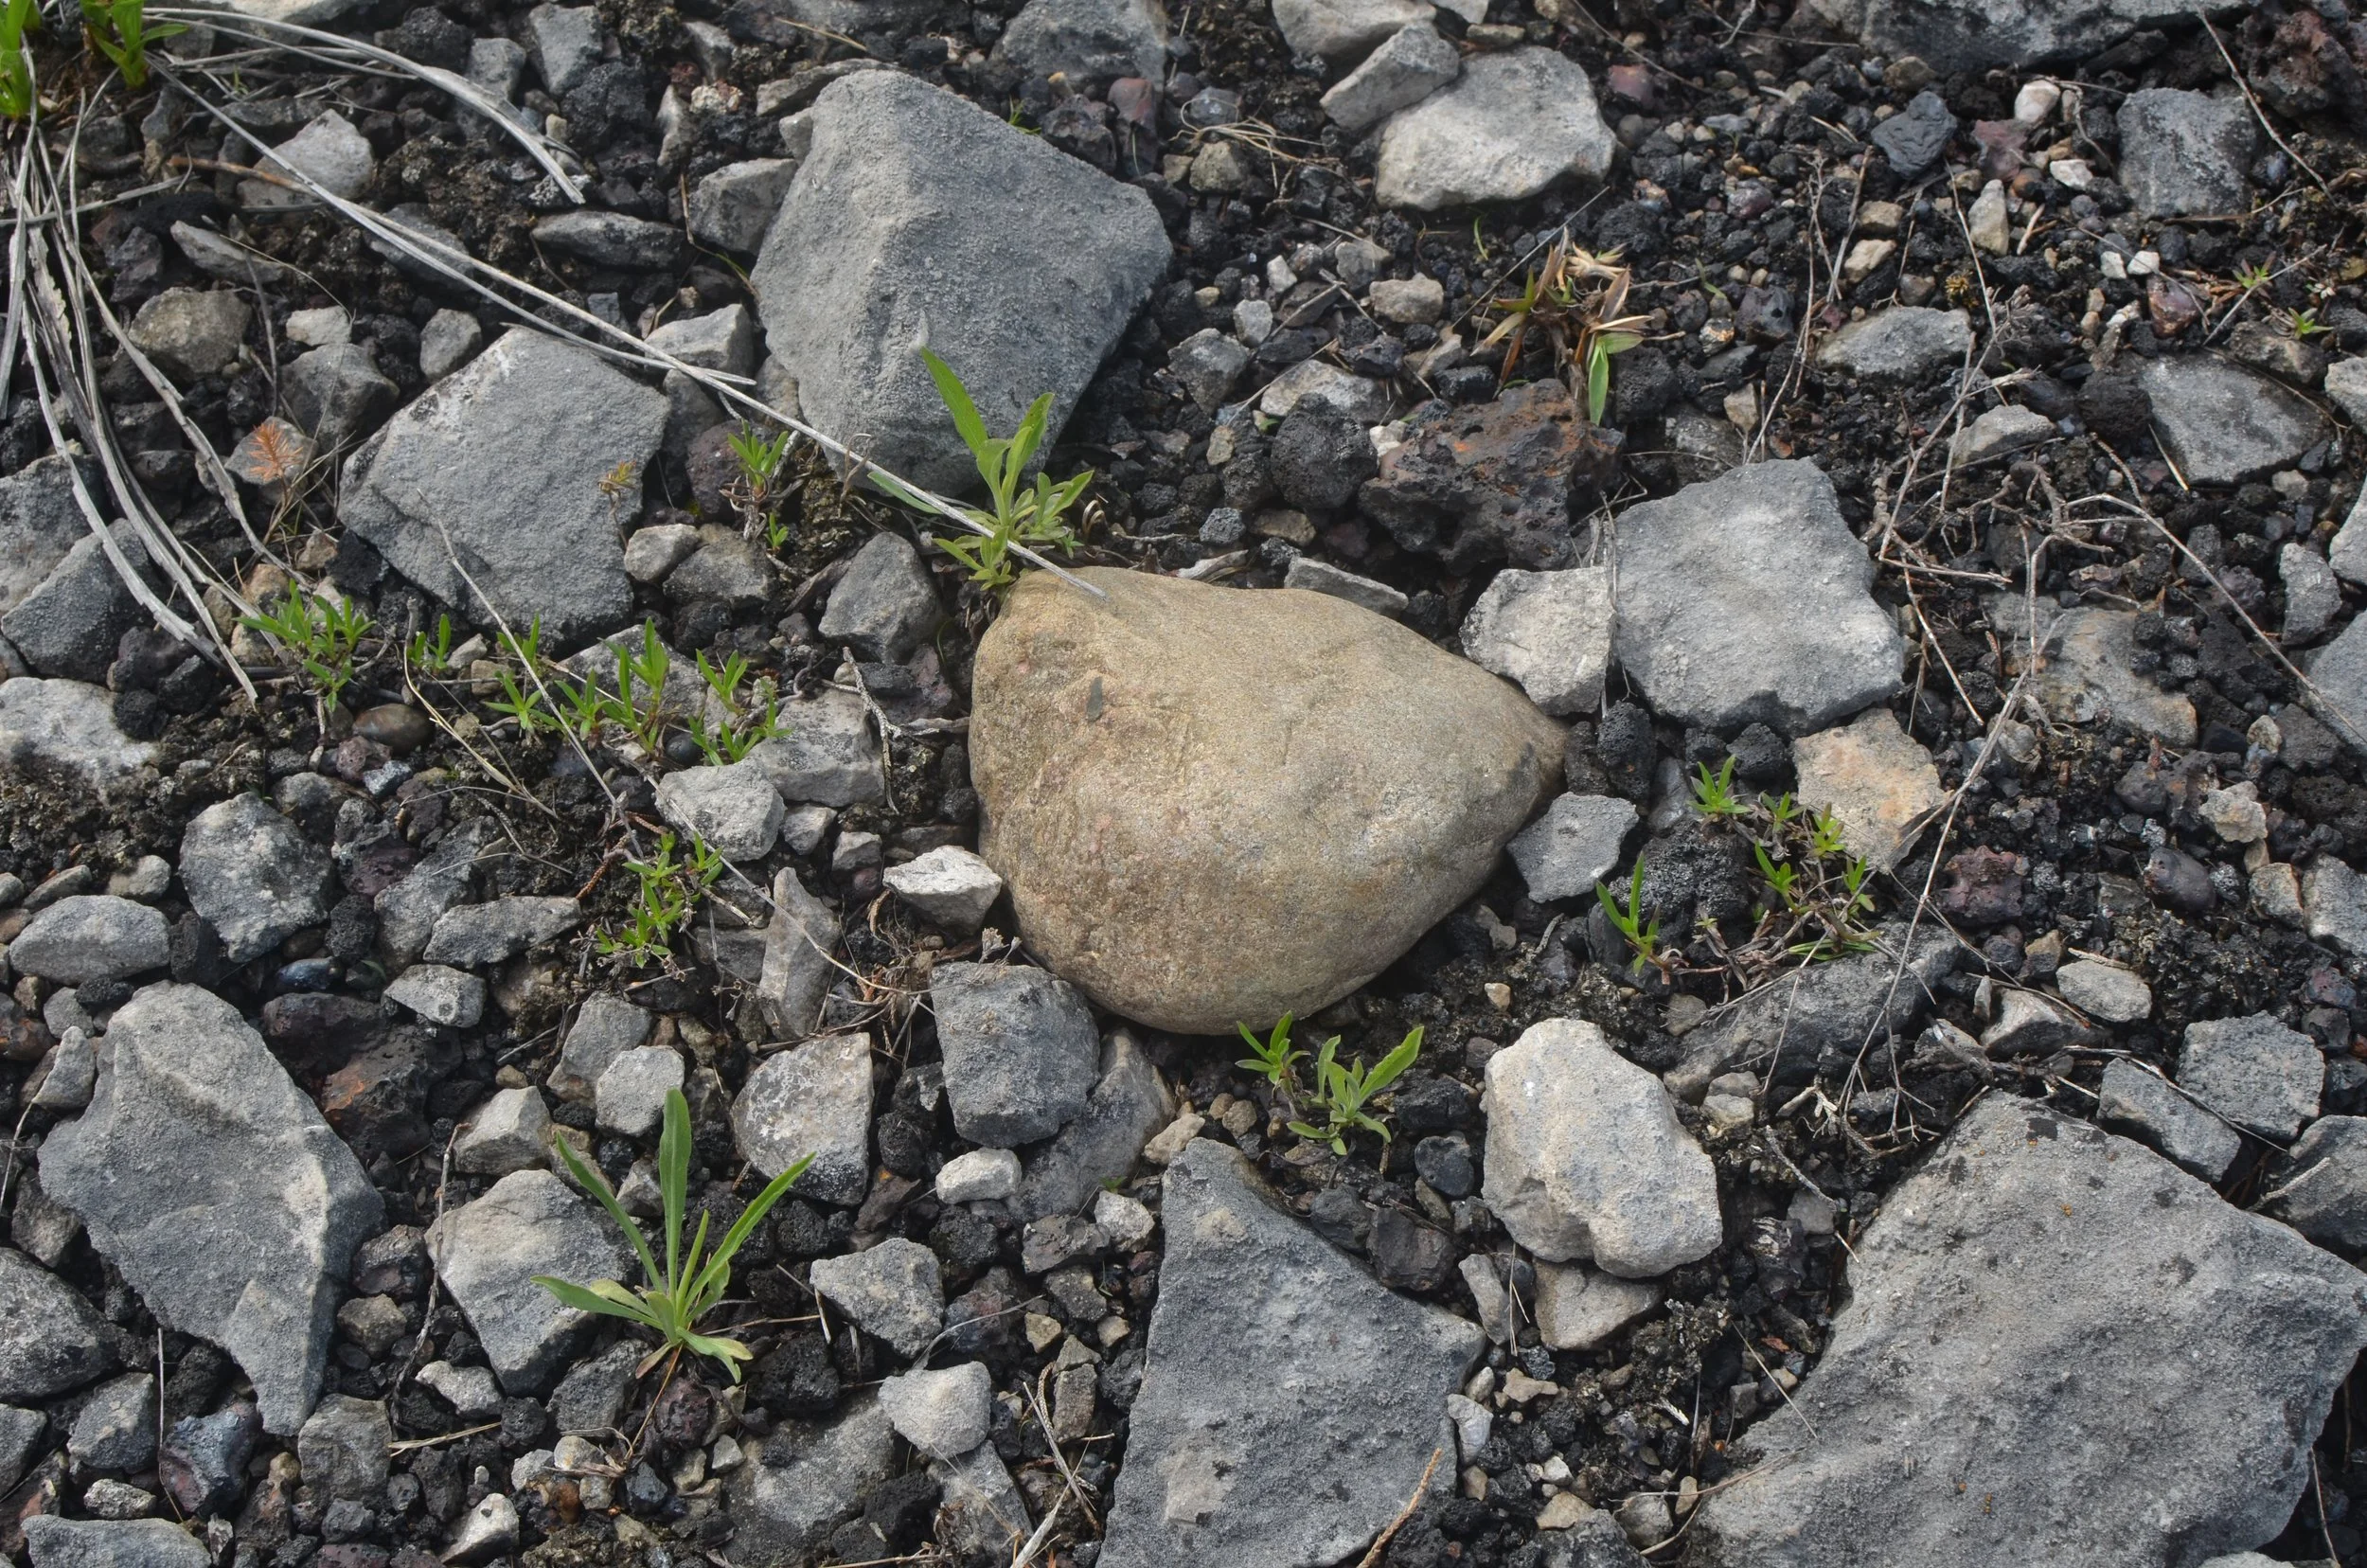
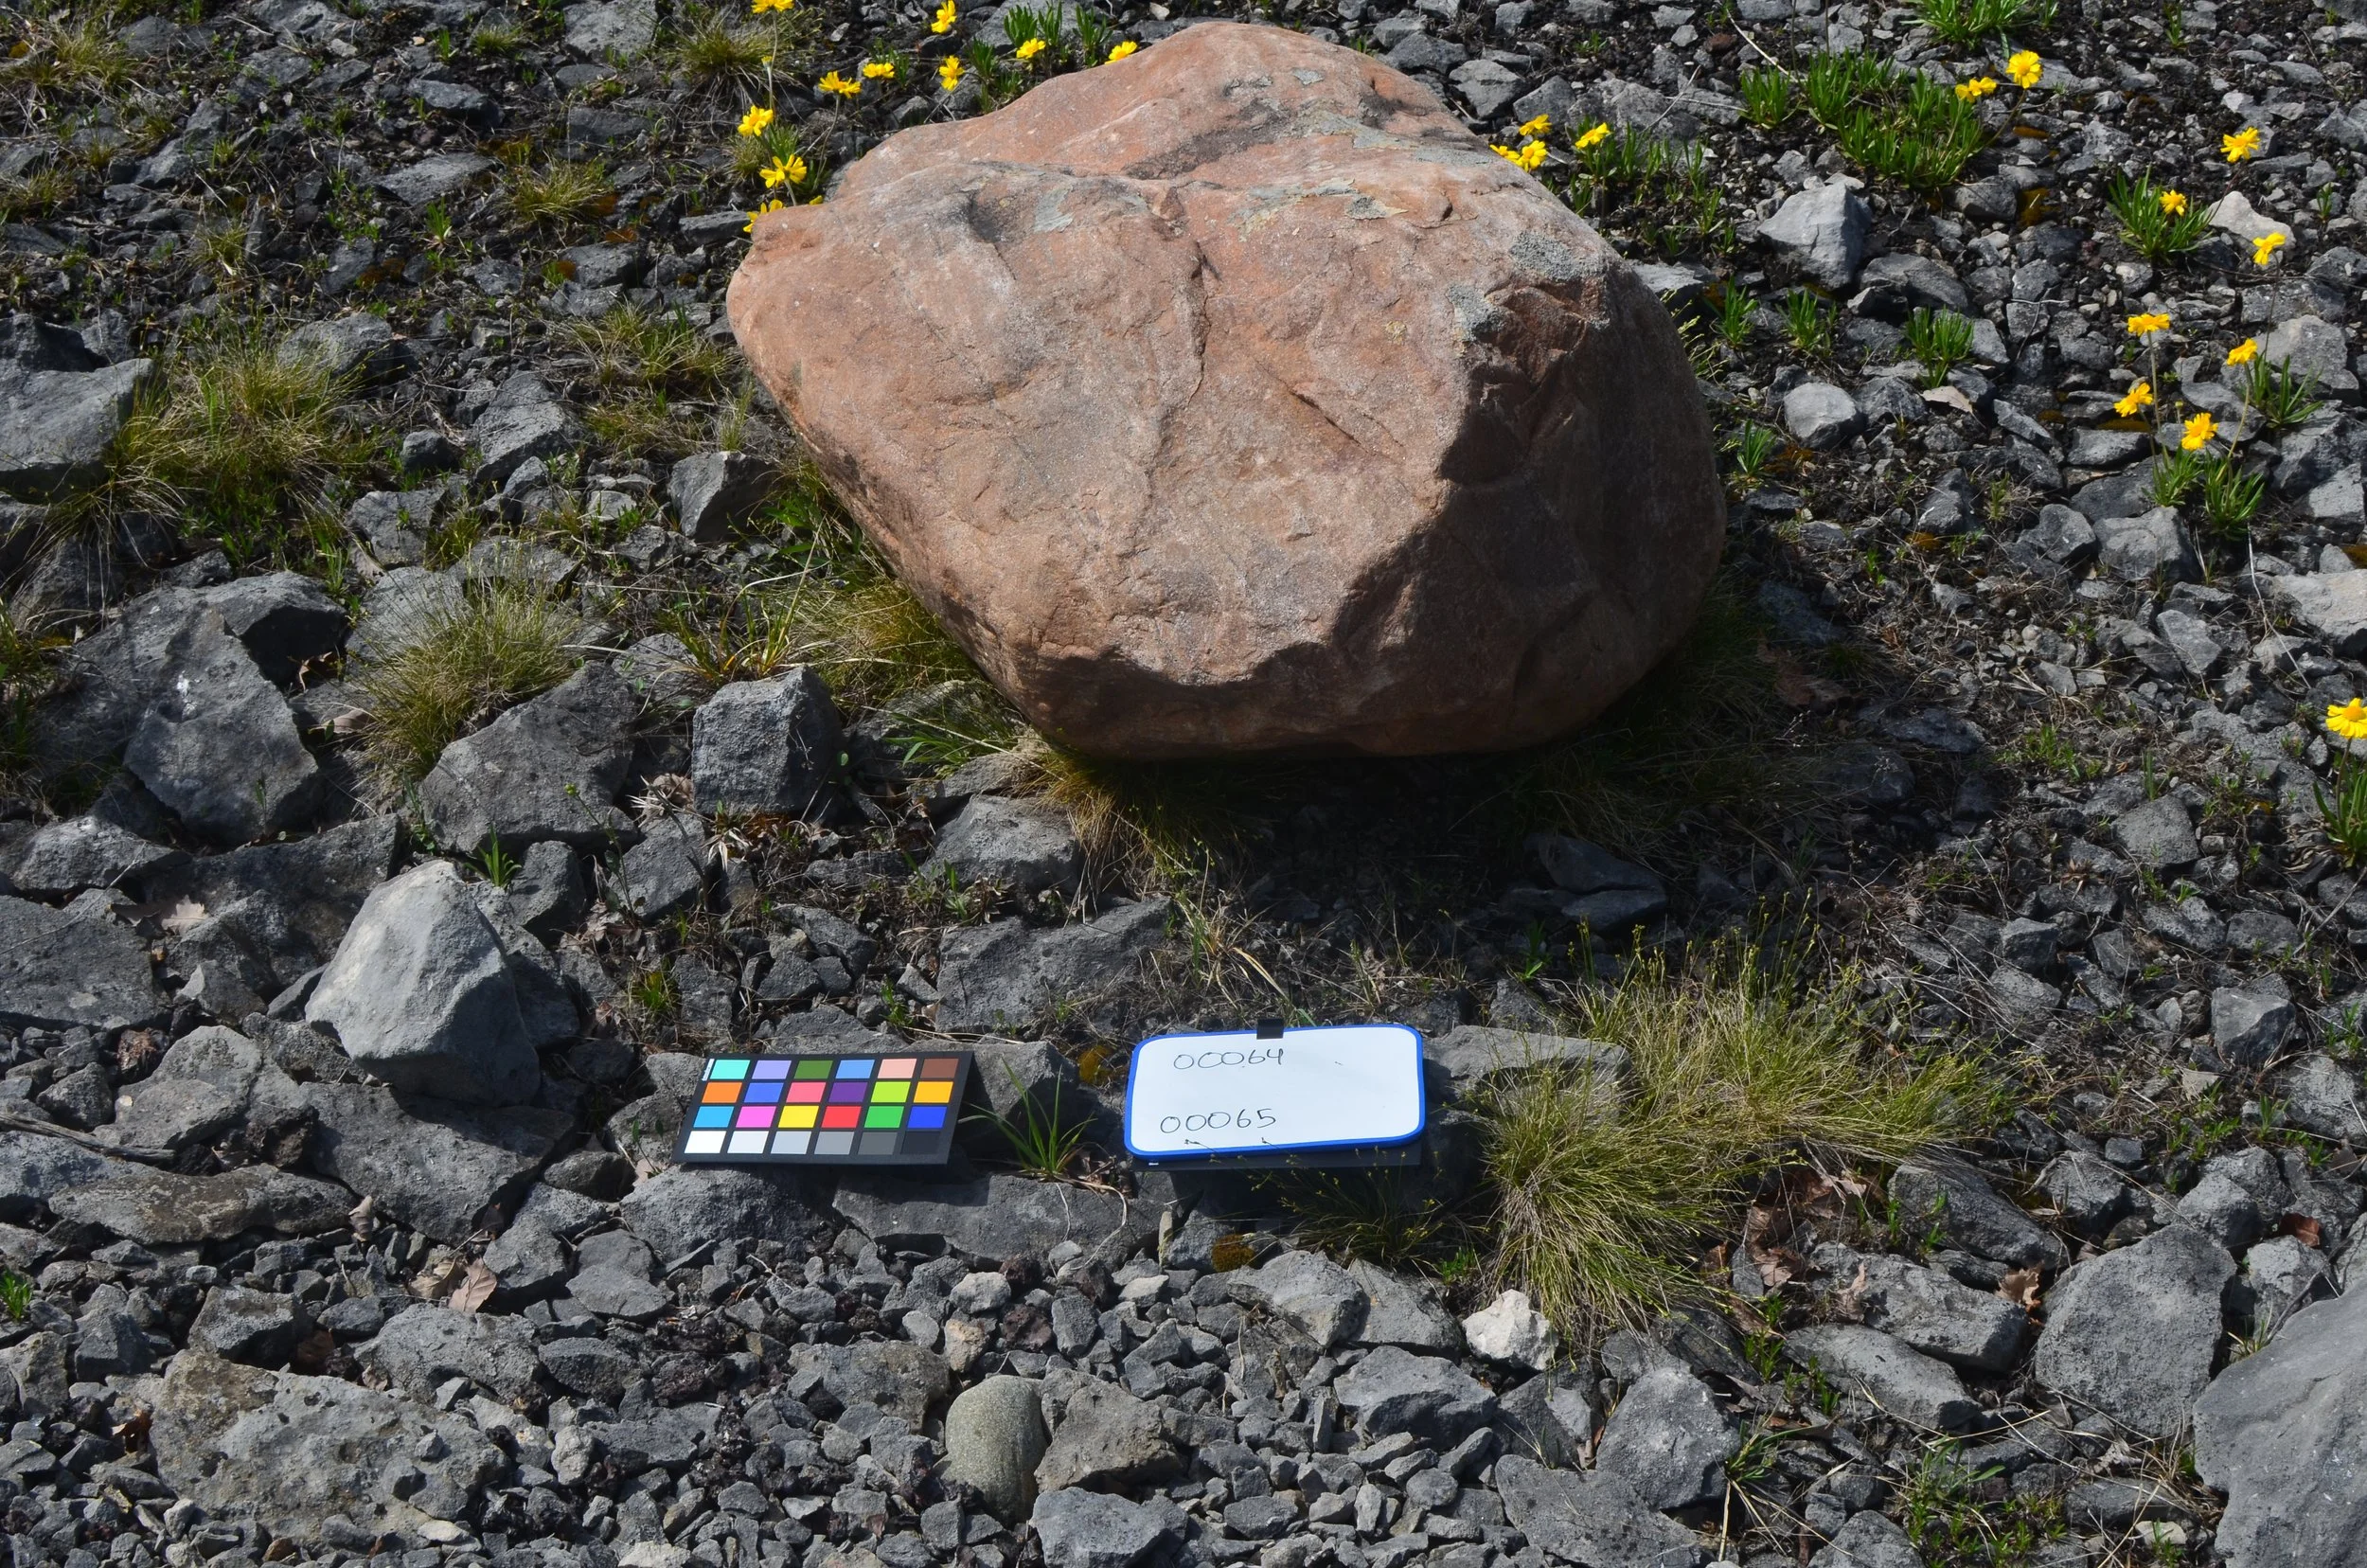
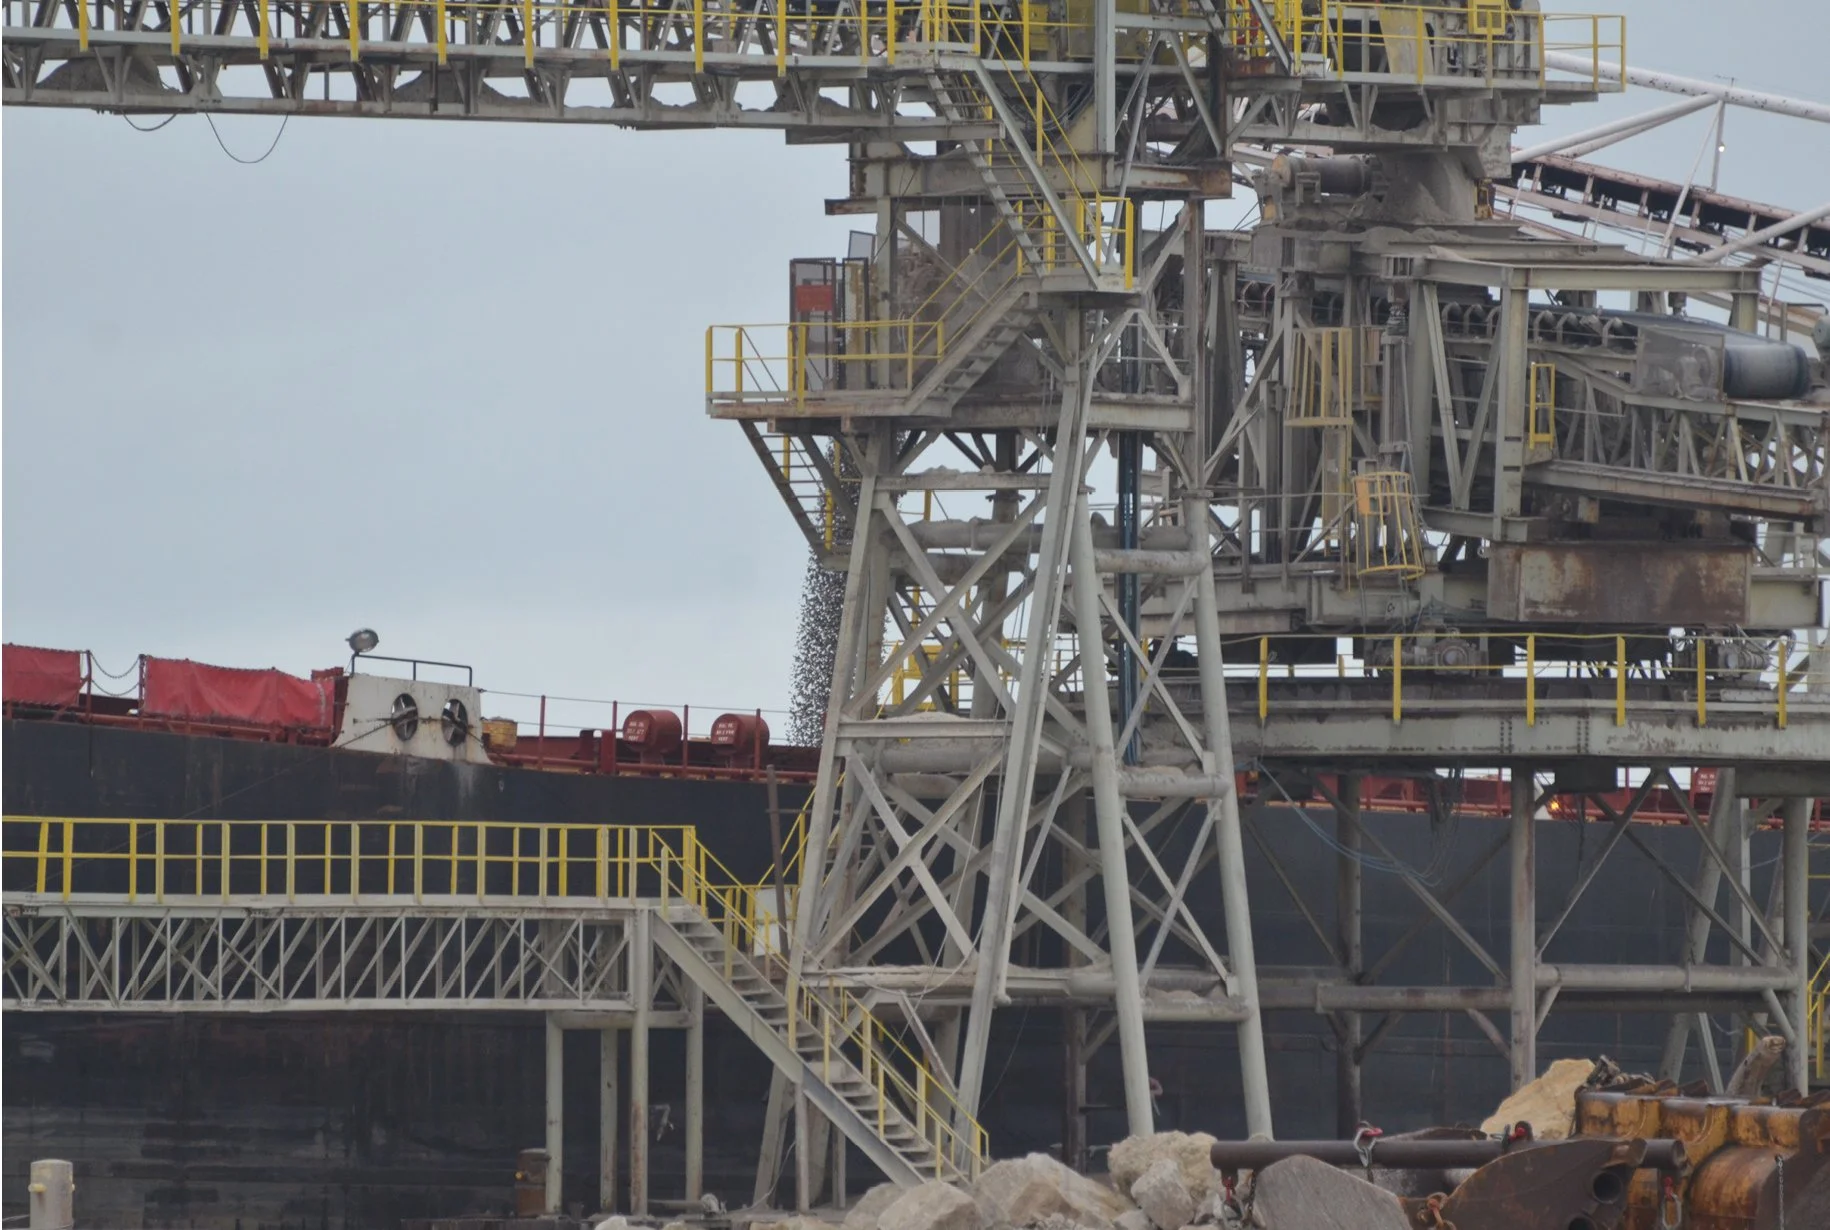
At the East Quarry site on Kelleys Island, the dominant material story is one of industrial extraction. Limestone was blasted, hauled, and commodified before the site was abandoned. But scattered across the quarry floor are stones that clearly don’t belong to this landscape: glacial erratics with smooth, rounded surfaces and hues distinct from the local bedrock. These rocks stand out from the local bedrock because they came from somewhere else.
During eight field deployments, I conducted a box search on foot to systematically locate and record all the glacial erratics inside the quarry. I located a total of 542 glacial erratics within the quarry boundary. These glacial stones were not the target material for the quarry crews, they were after the limestone, so the glacial stones were cast aside. By cataloging these non-target stones and mapping their relation to the limestone quarry patterns, I was able to make legible the decision-making strategies employed in this long-abandoned site.
This project began as a field-based inventory of these overlooked stones, identified through perceptual cues like color and form contrast. But it evolved into something more: a meditation on pattern recognition, material mismatch, and the cognitive structure of categories. Using aggregate image analysis, I produced layered composites that allow a statistical prototype to emerge, an abstracted center of the category “glacial stone,” coalesced from the peripheral debris of this disrupted landscape.
project brief
This project began with a question of legibility, whether the residual stone field could reveal the sorting protocols once used by quarry workers. But layered beneath that was another line of inquiry: could this same site also register the deeper geologic history of glacial movement across the island? As I documented and analyzed non-target materials left in place or pushed aside, I treated each glacial stone not only as a trace of human decision-making but also as an index of Pleistocene deposition. The resulting analysis reads the site as a dual archive: one shaped by industrial logic, the other by glacial force

Insights & Outcomes
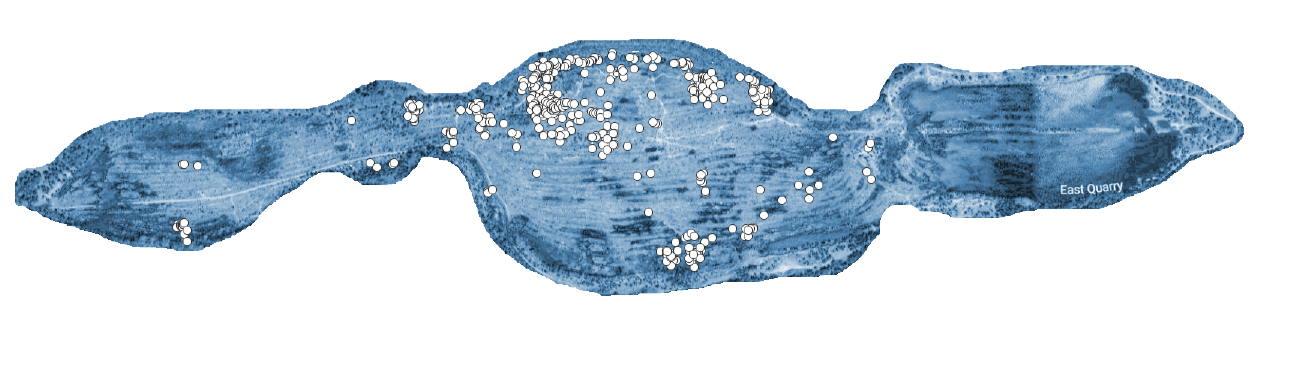
My analysis surfaced distinct patterns that point to both operational intent and geologic residue. A notable concentration of glacial stones at the north-central quarry wall suggests this zone functioned as a secondary staging area for non-target material, likely moved aside during primary extraction. By interpreting these patterns through the lens of industrial prioritization (specifically, the drive to isolate flux-grade limestone) the site reads as a by-product of deliberate sorting processes. Density mapping and distribution models of erratic discard caches allowed for a reconstruction of movement pathways across the quarry floor, offering insight into how material flow was organized spatially.
Through composite statistical image analysis (see below), I established a benchmark for the prototypical glacial stone shape at this site, creating a visual and typological reference for future fieldwork. This contributed to the development of a transferable inventory framework capable of identifying glacial erratics in post-extraction contexts across similar limestone landscapes. Applying this framework enabled a cross-site comparison that revealed shared operational signatures between the Kelleys Island quarries and the Rockport site in Michigan, suggesting not just common glacial origins, but also similar industrial handling practices. In fact, I discovered in secondary research that both quarries at one time were operated by the same company: Kelley Island Lime & Transport (nb: this is the correct spelling). My project archive now serves as a navigable tool for comparative analysis across extraction landscapes shaped by both glacial processes and human systems.
Methods


Data Collection
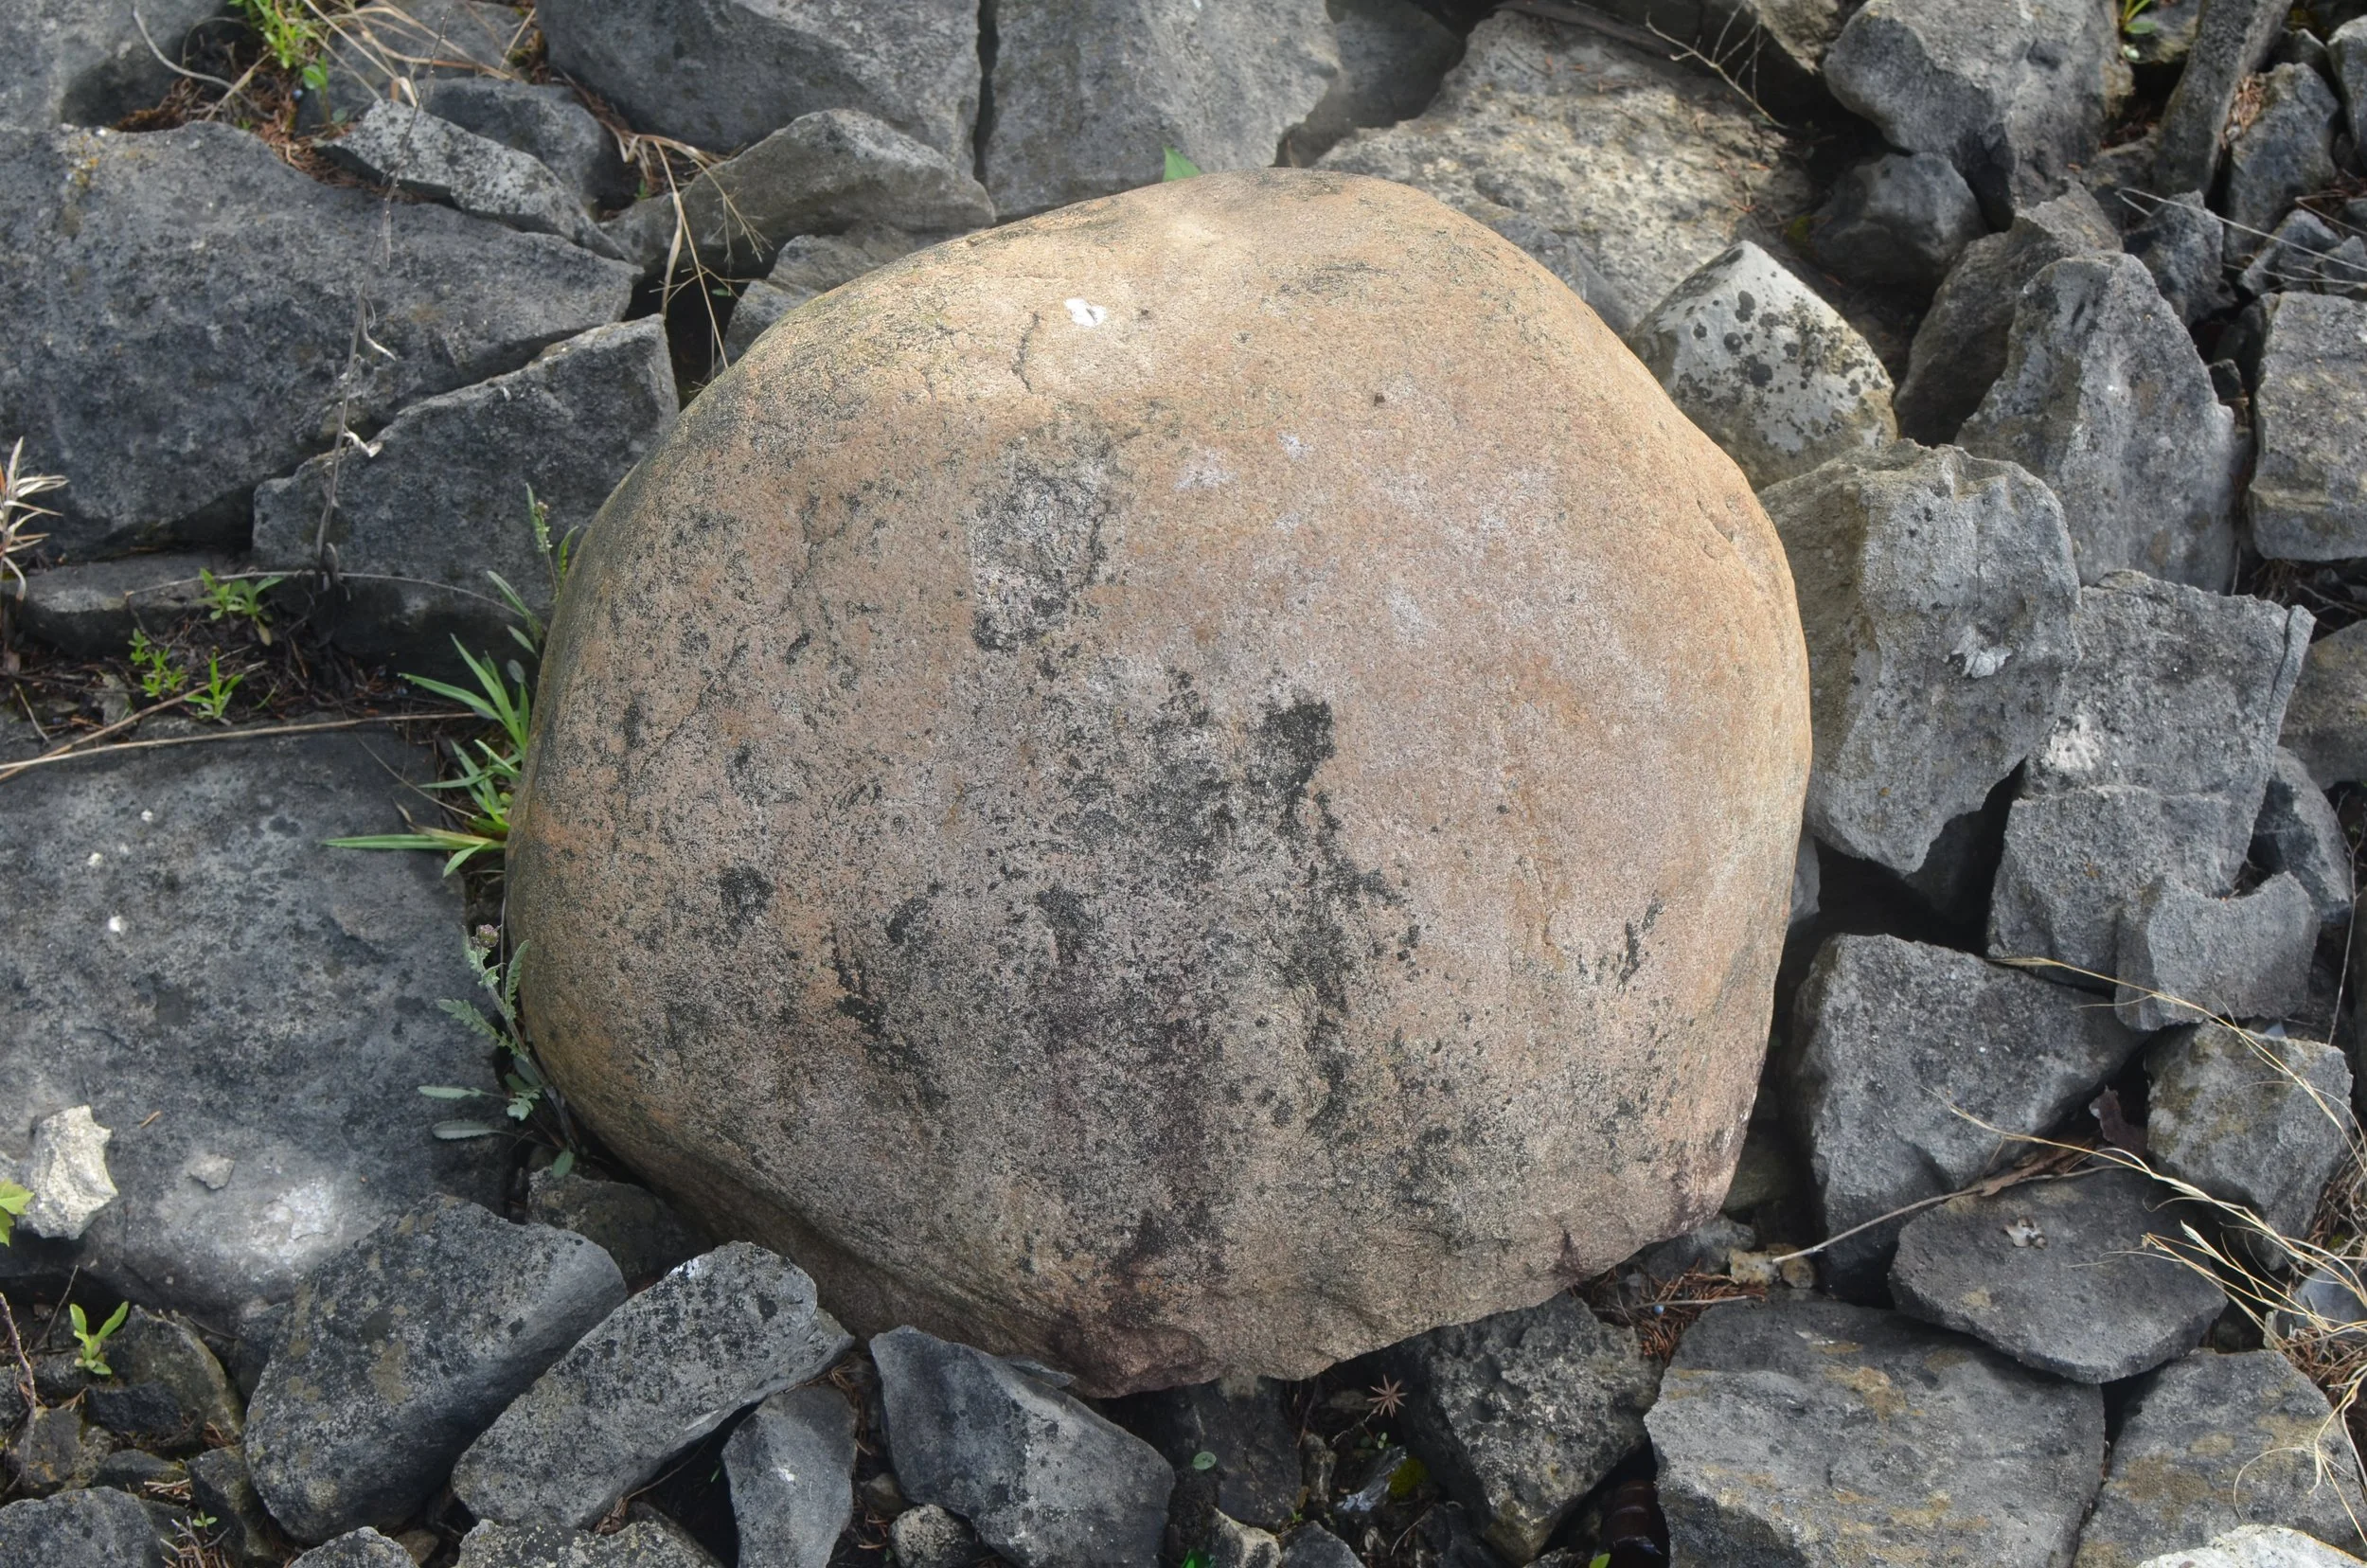
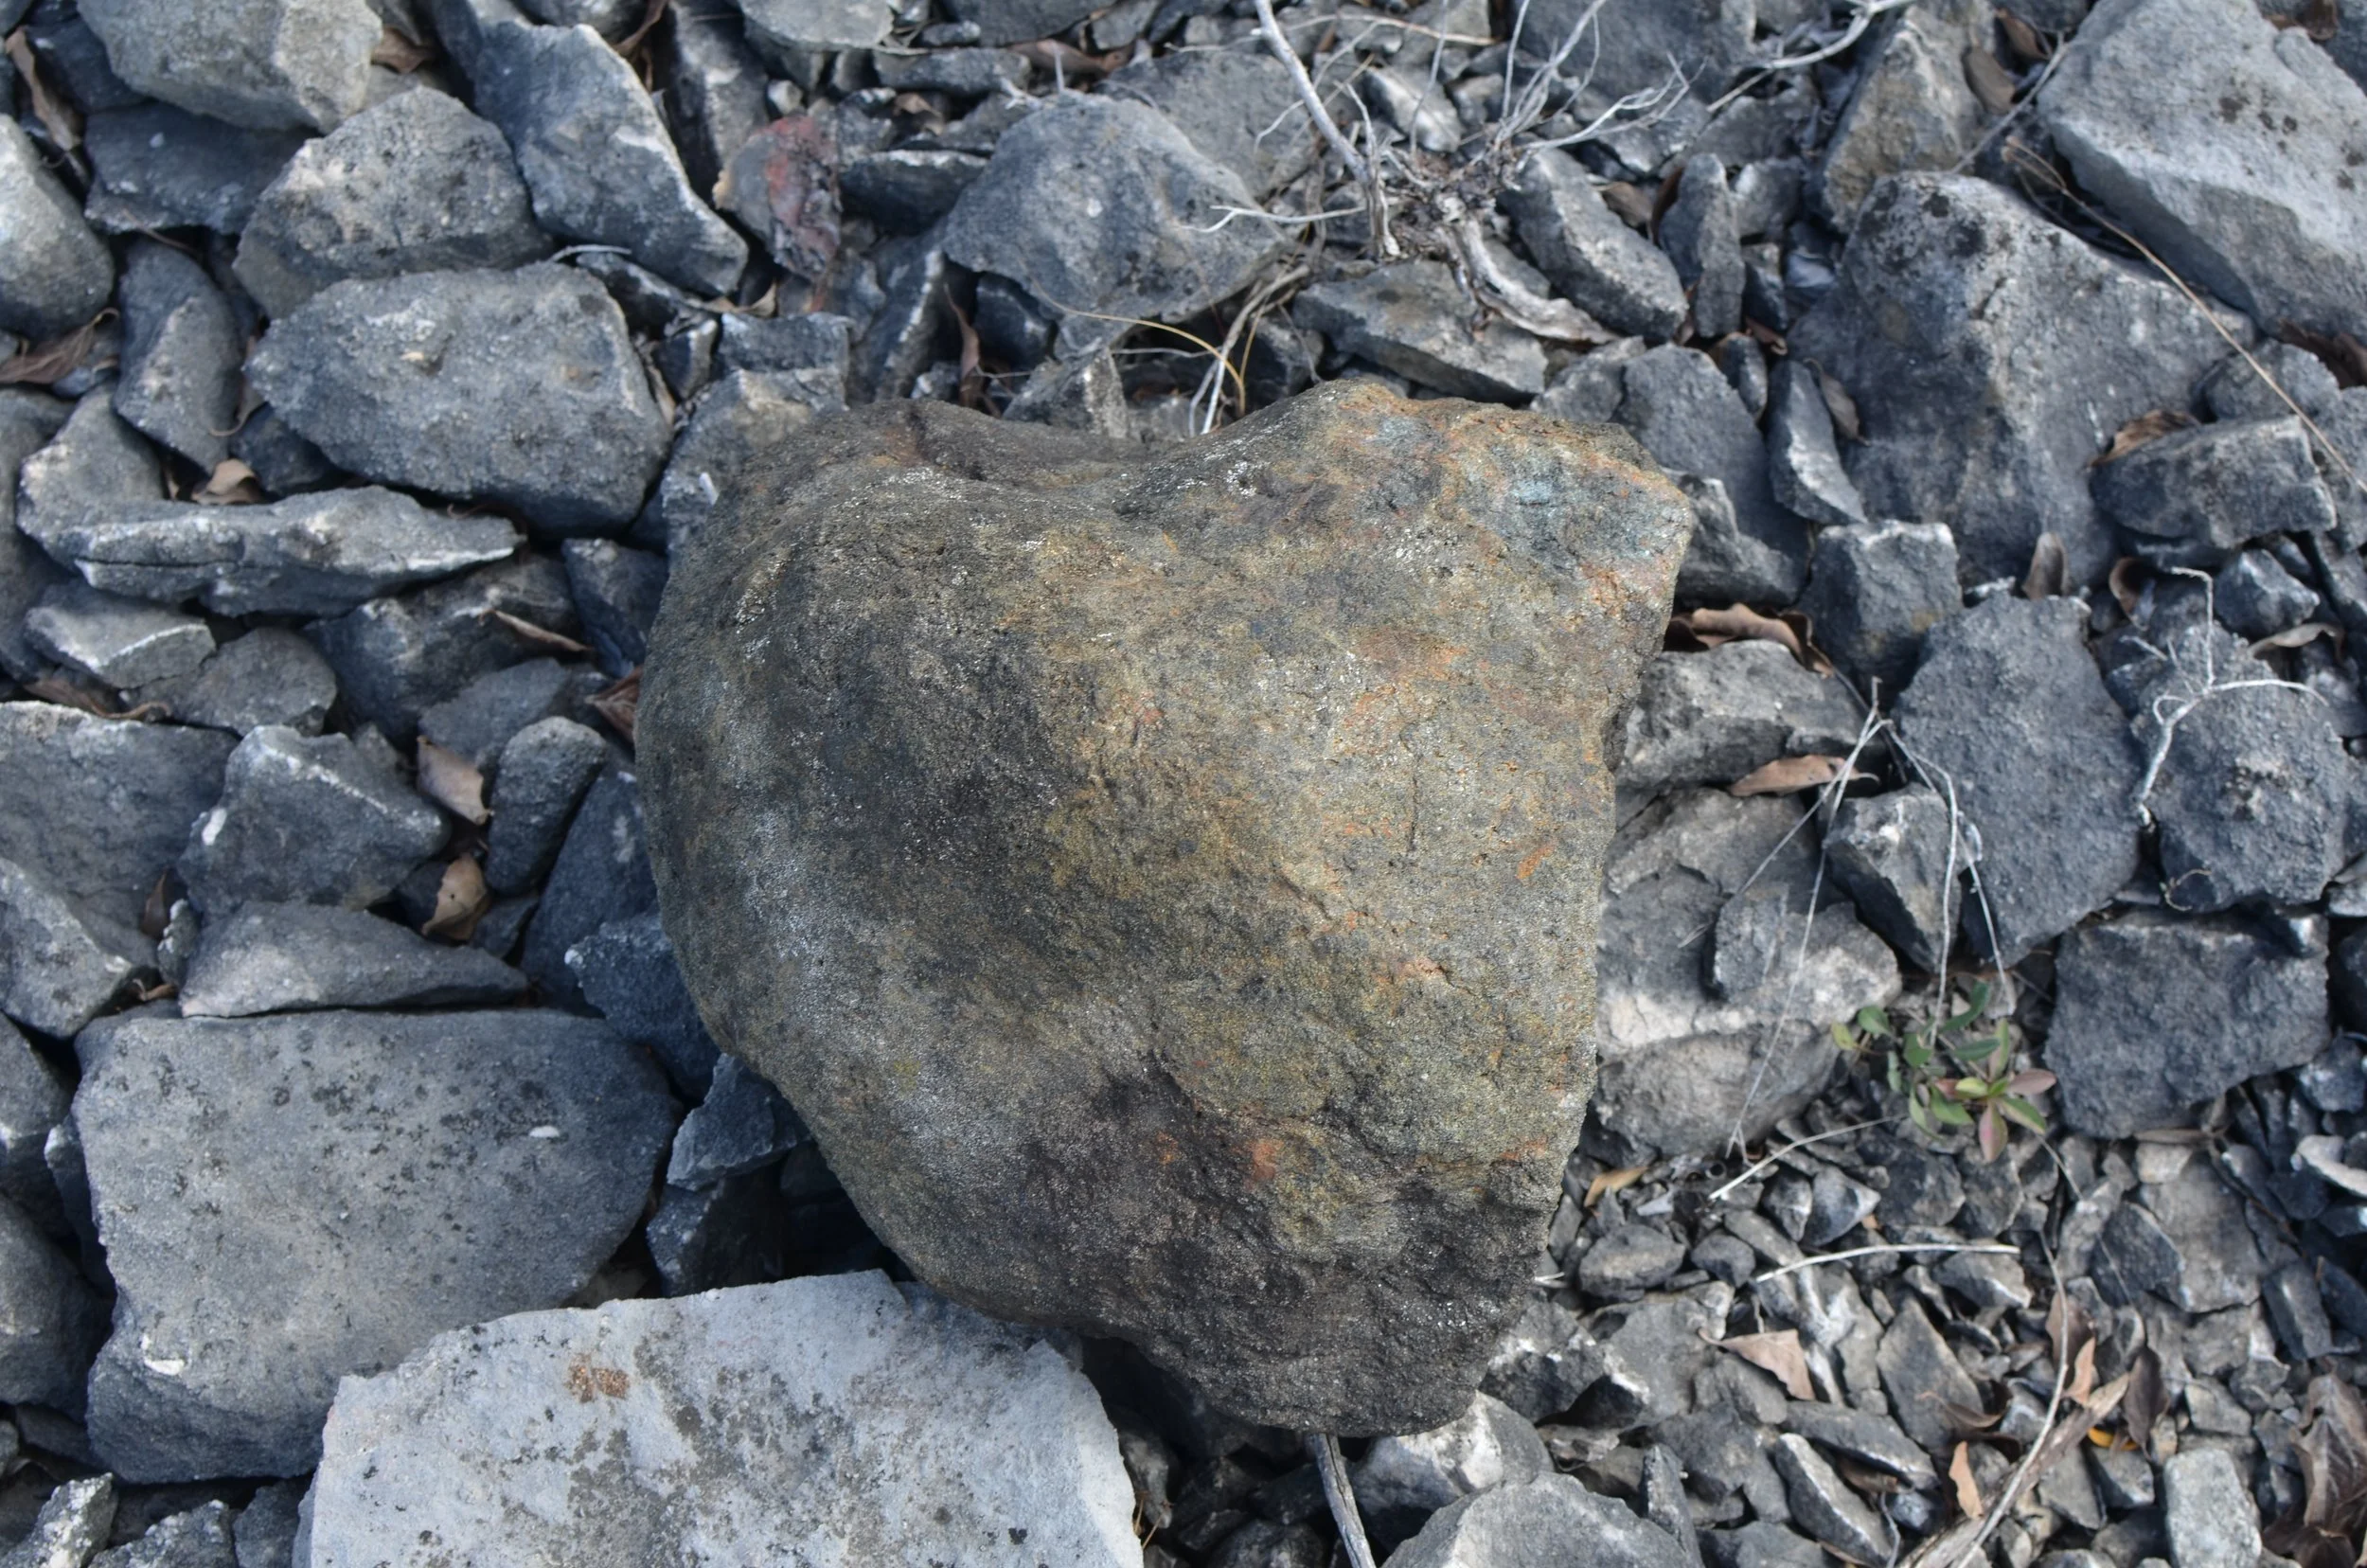
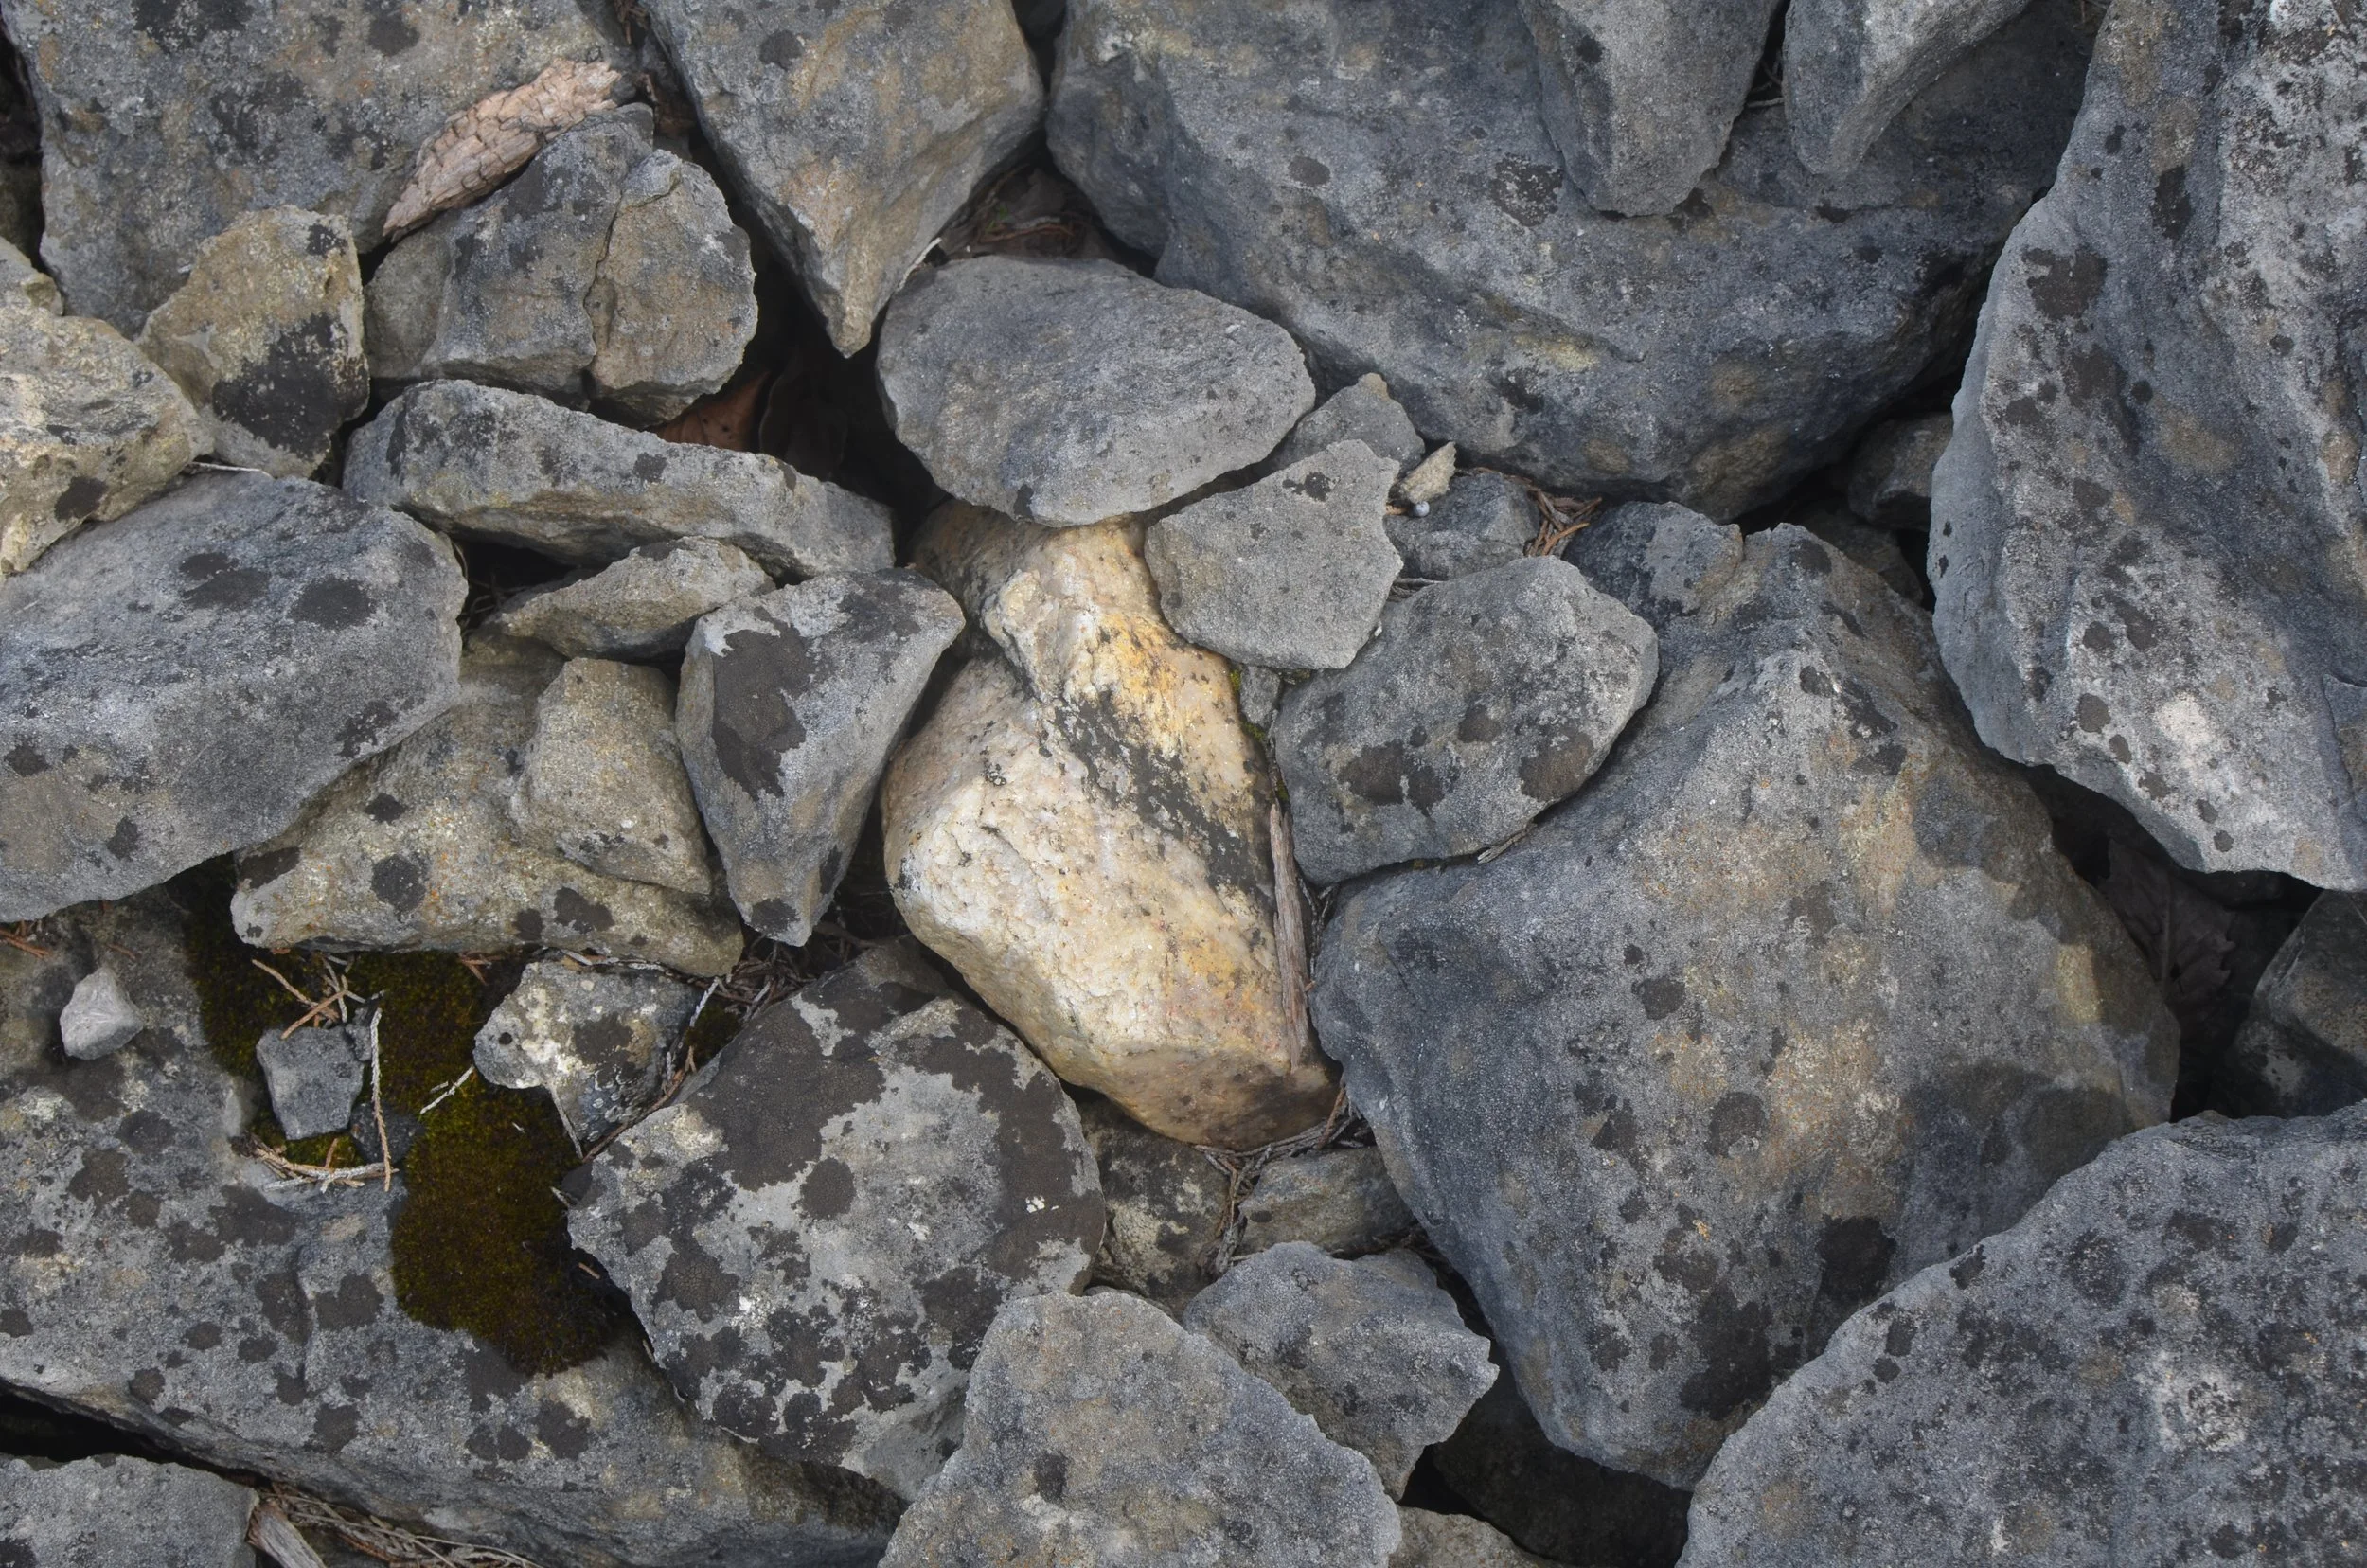
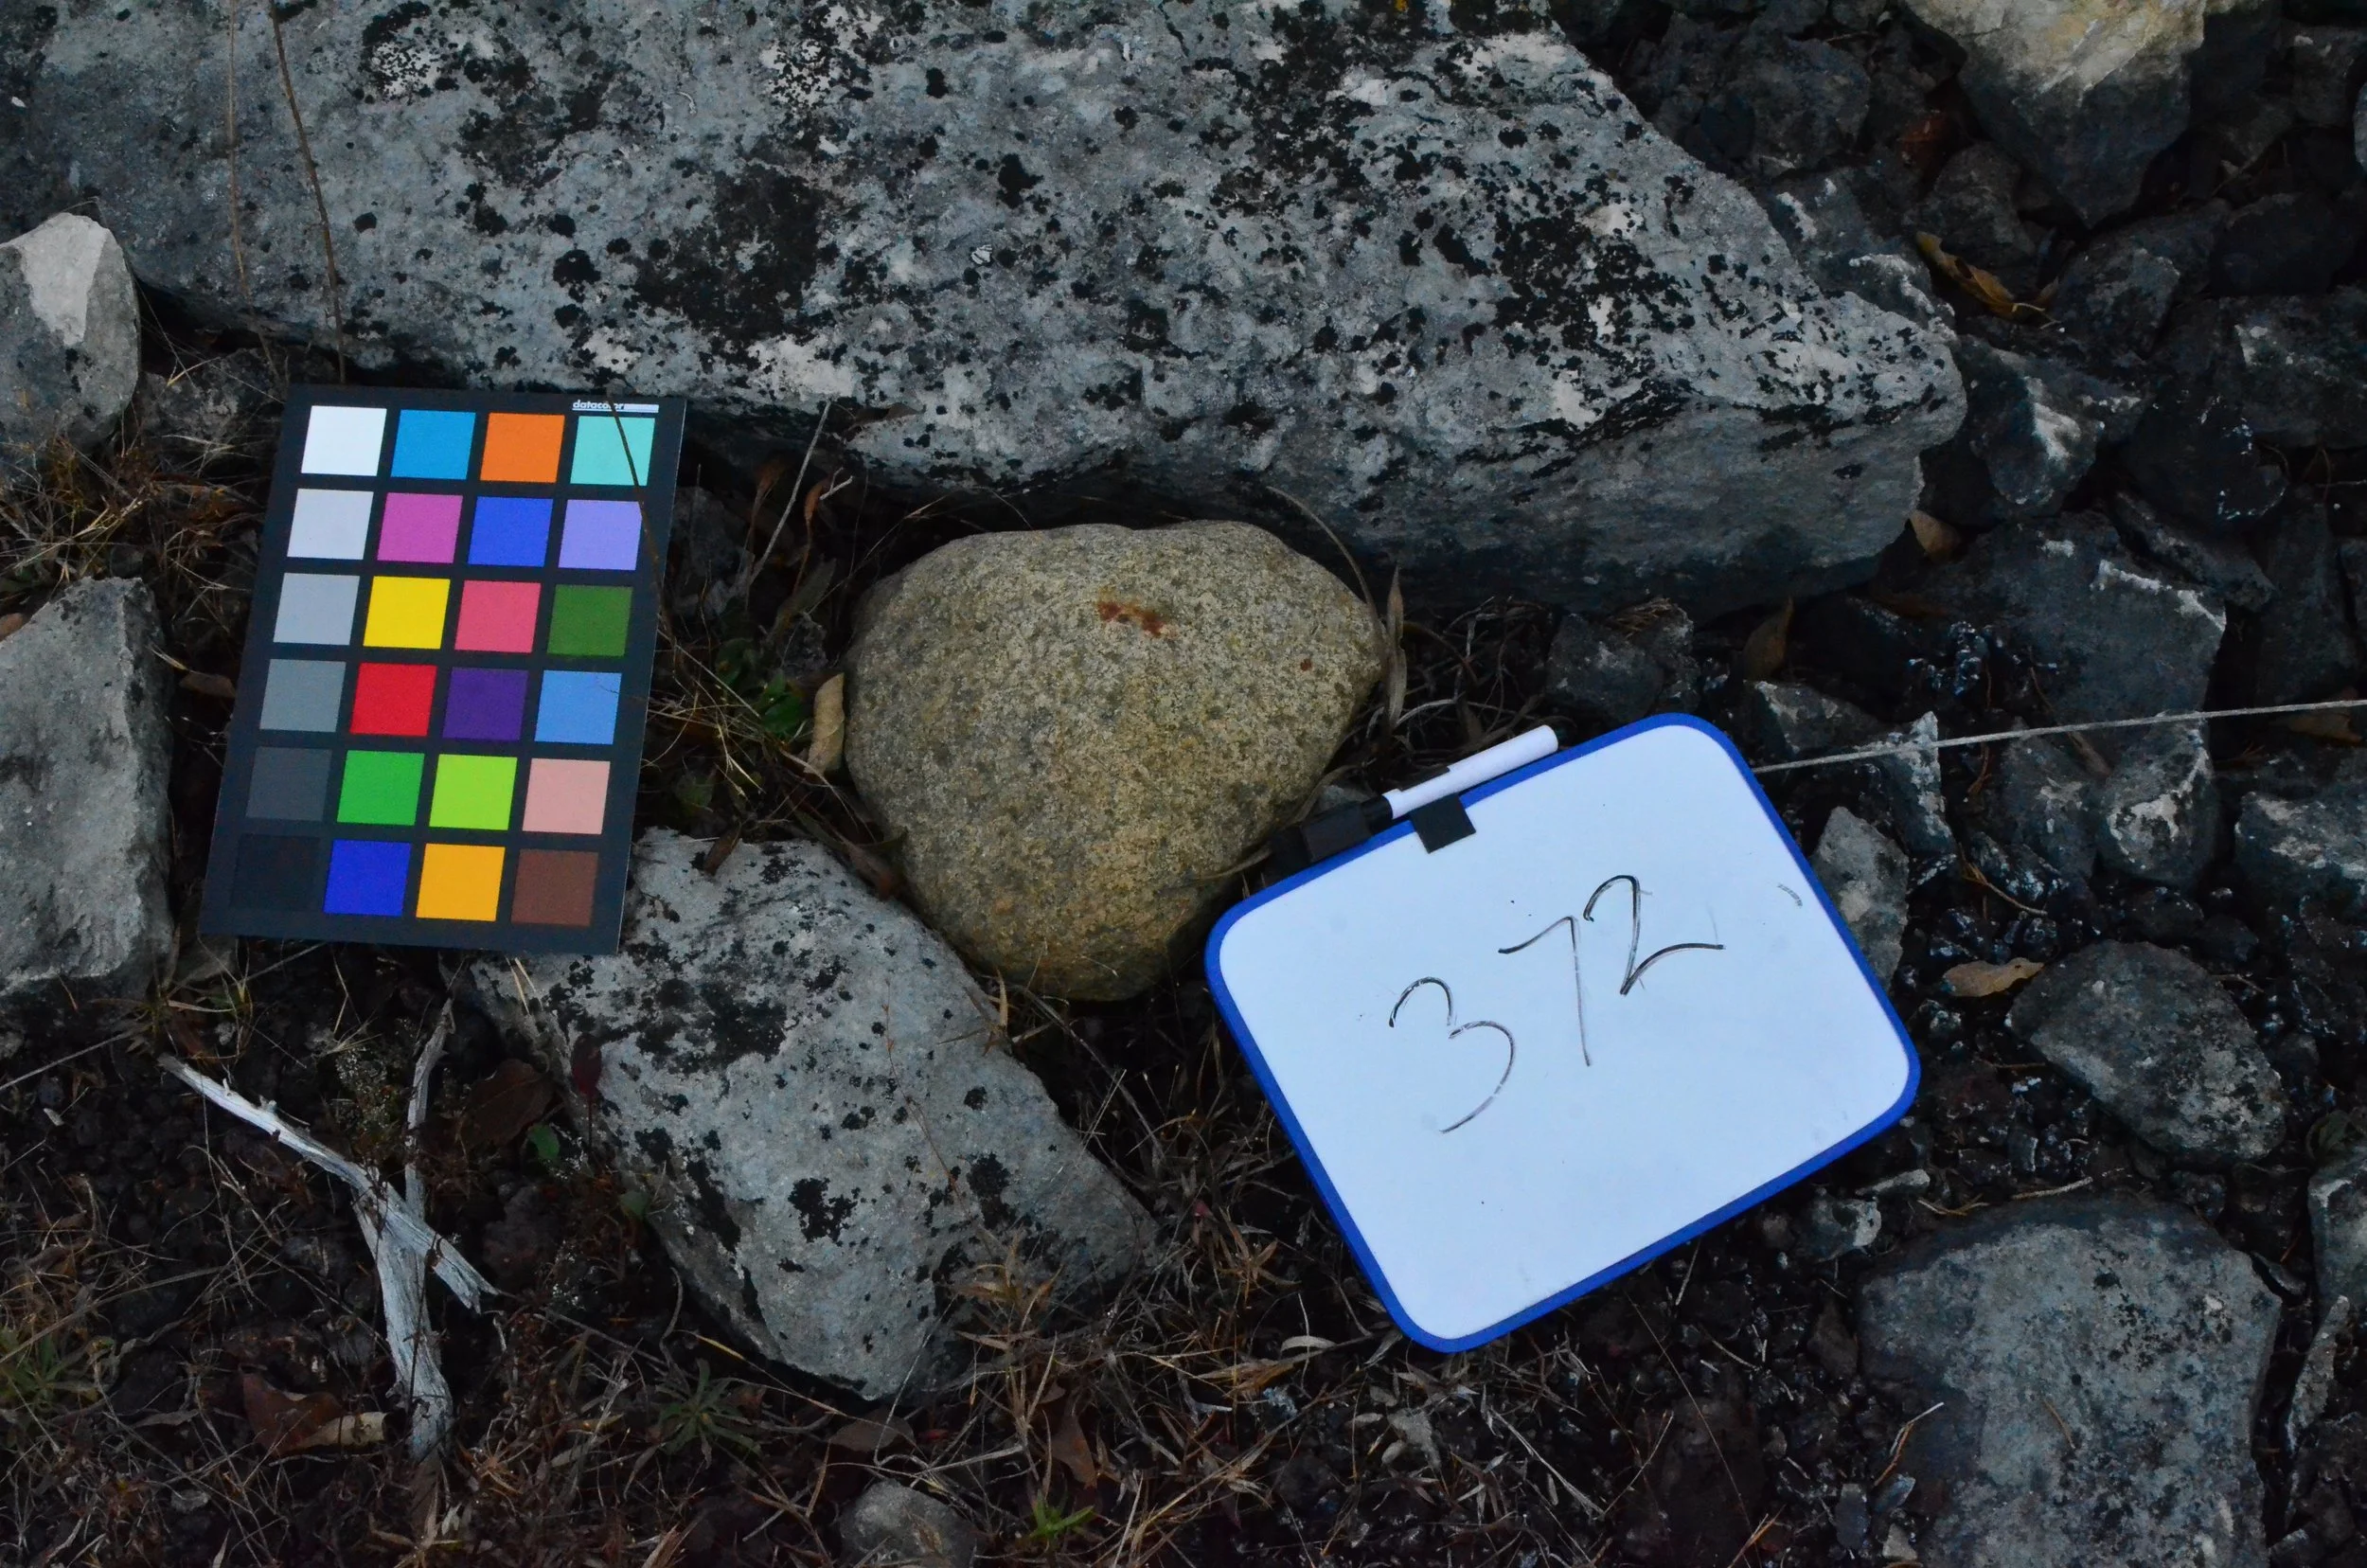
To capture the distribution of glacial erratics across the site, I conducted a systematic box-grid traversal over the course of eight field deployments. At each point of find, I logged key attributes of every stone, including size, shape (with emphasis on roundedness), lithology, and GPS coordinates. This data collection protocol enabled the mapping of spatial concentrations with precision. Standardized, color-corrected photographs were taken on-site to preserve visual fidelity and create a consistent reference layer. The resulting dataset provides both geospatial and typological resolution, supporting subsequent analysis of material clustering and extraction-era sorting behaviors.
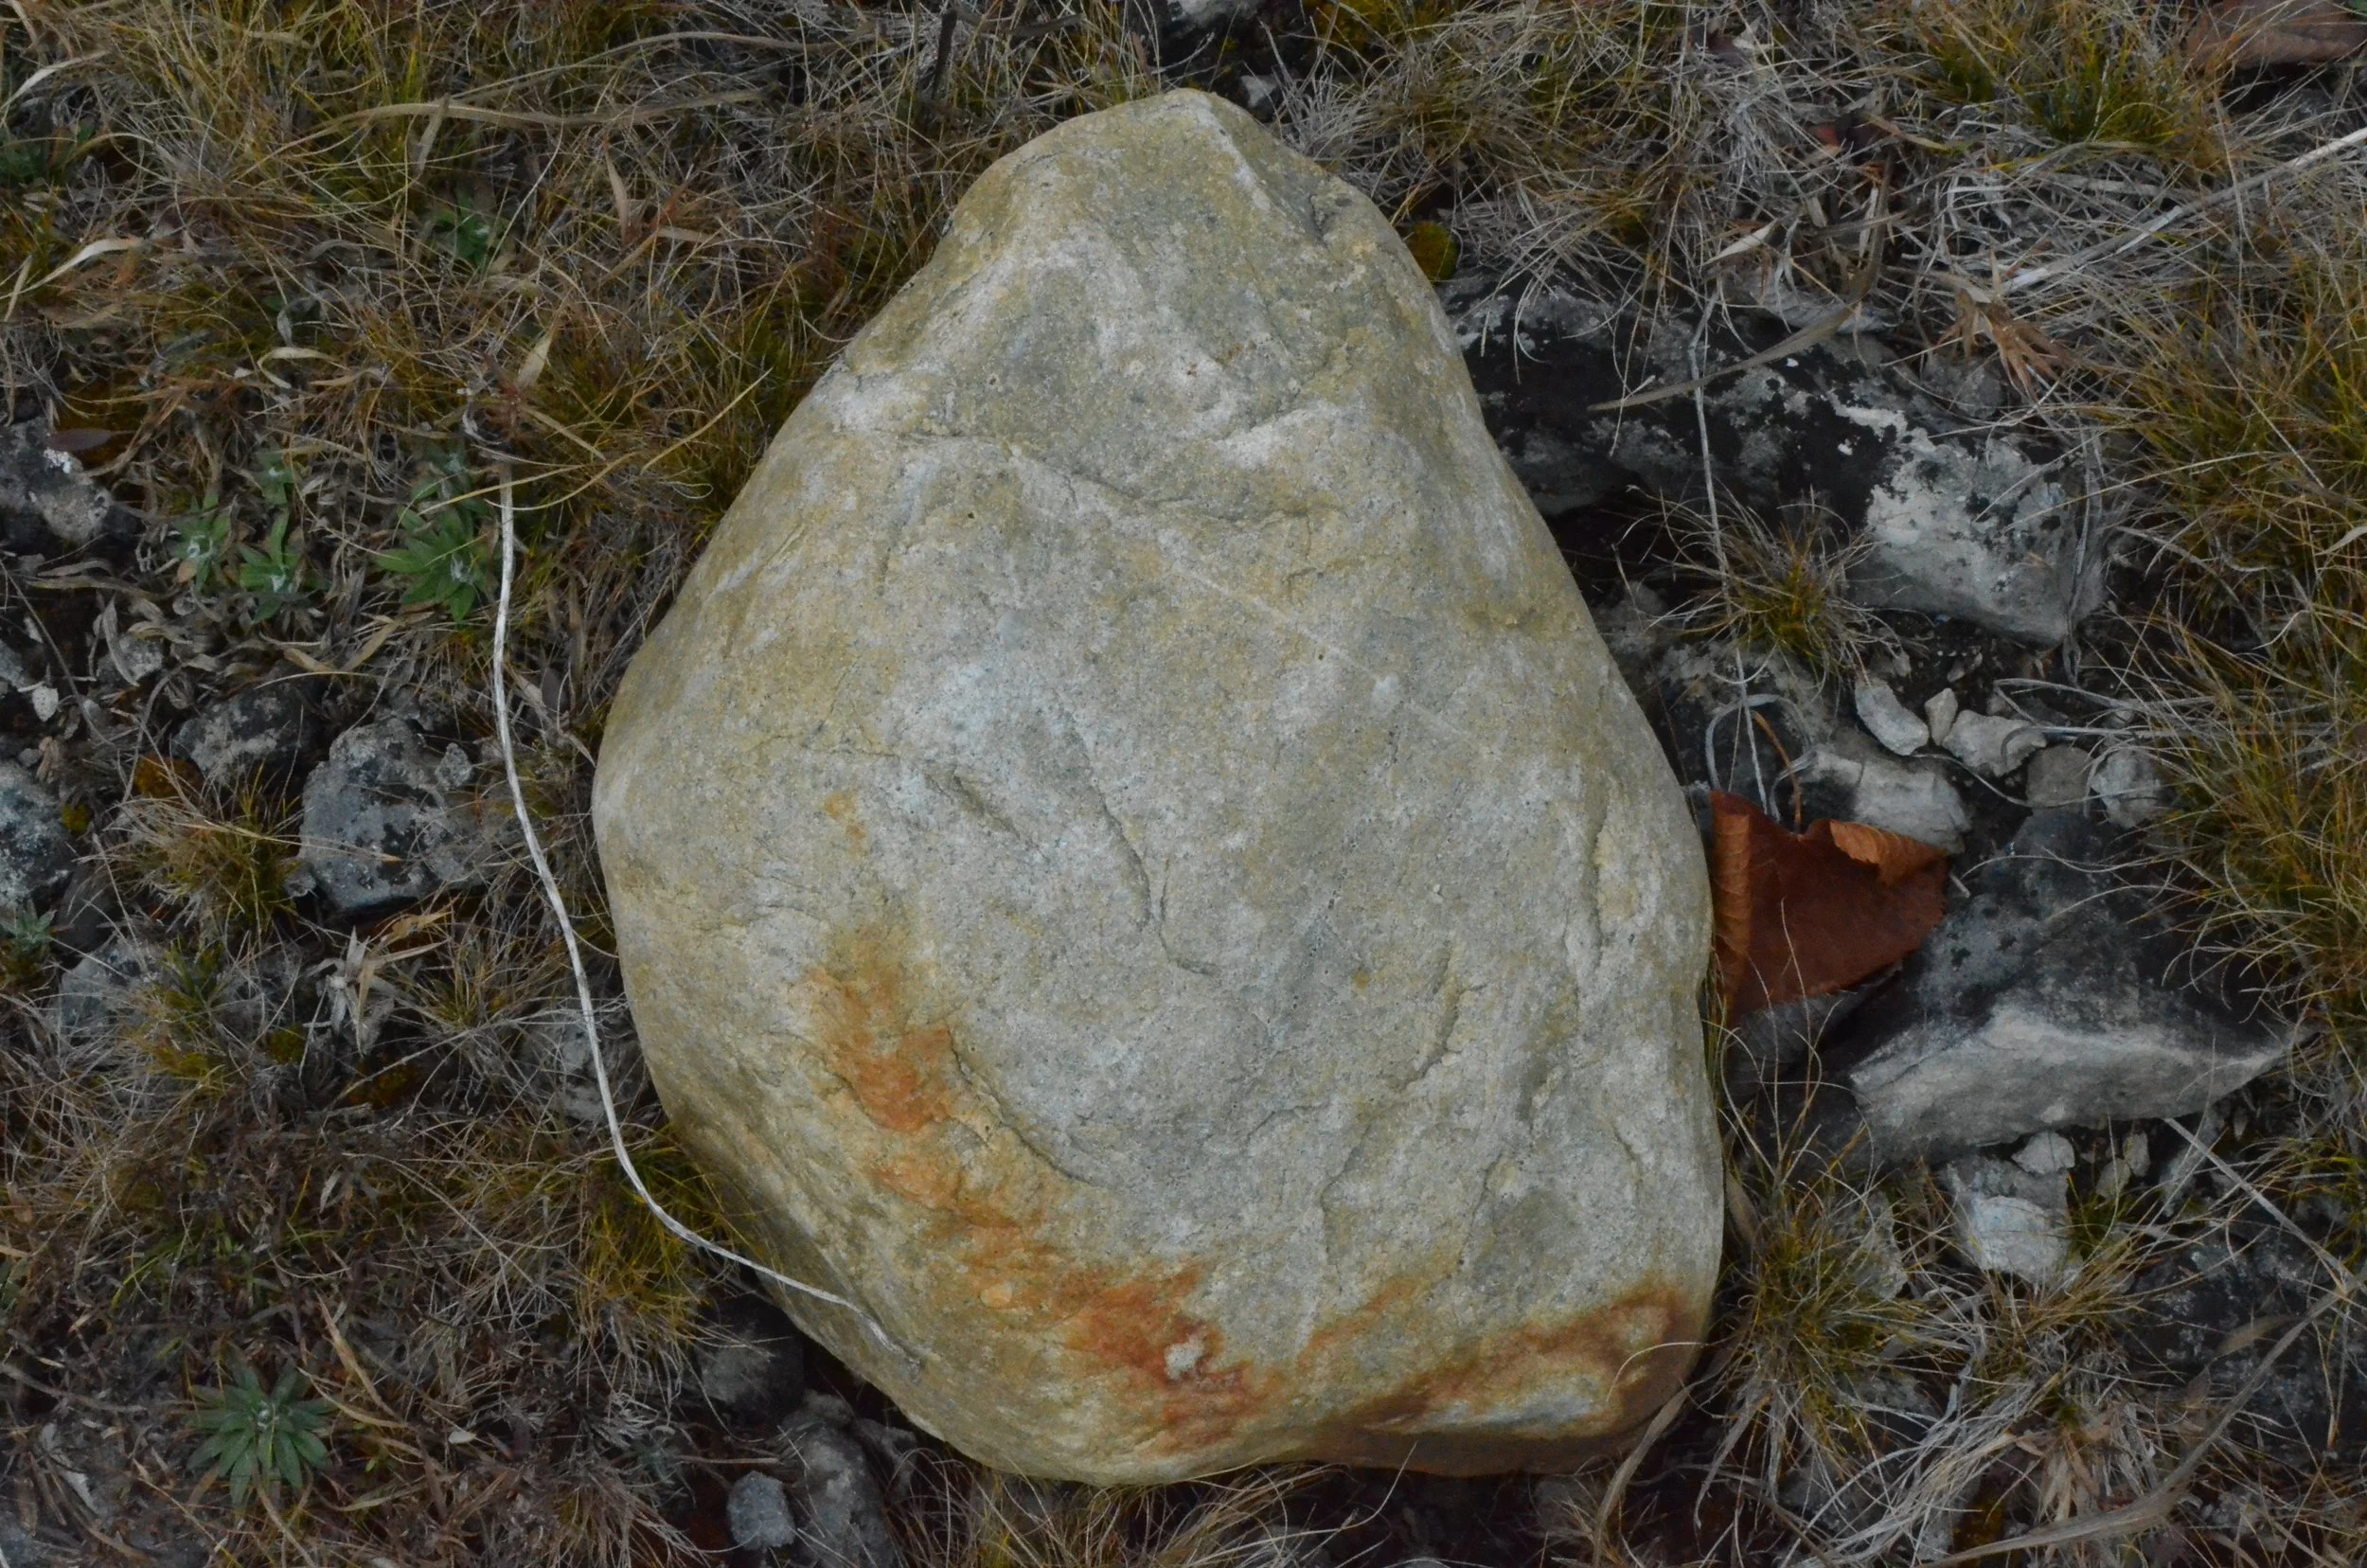
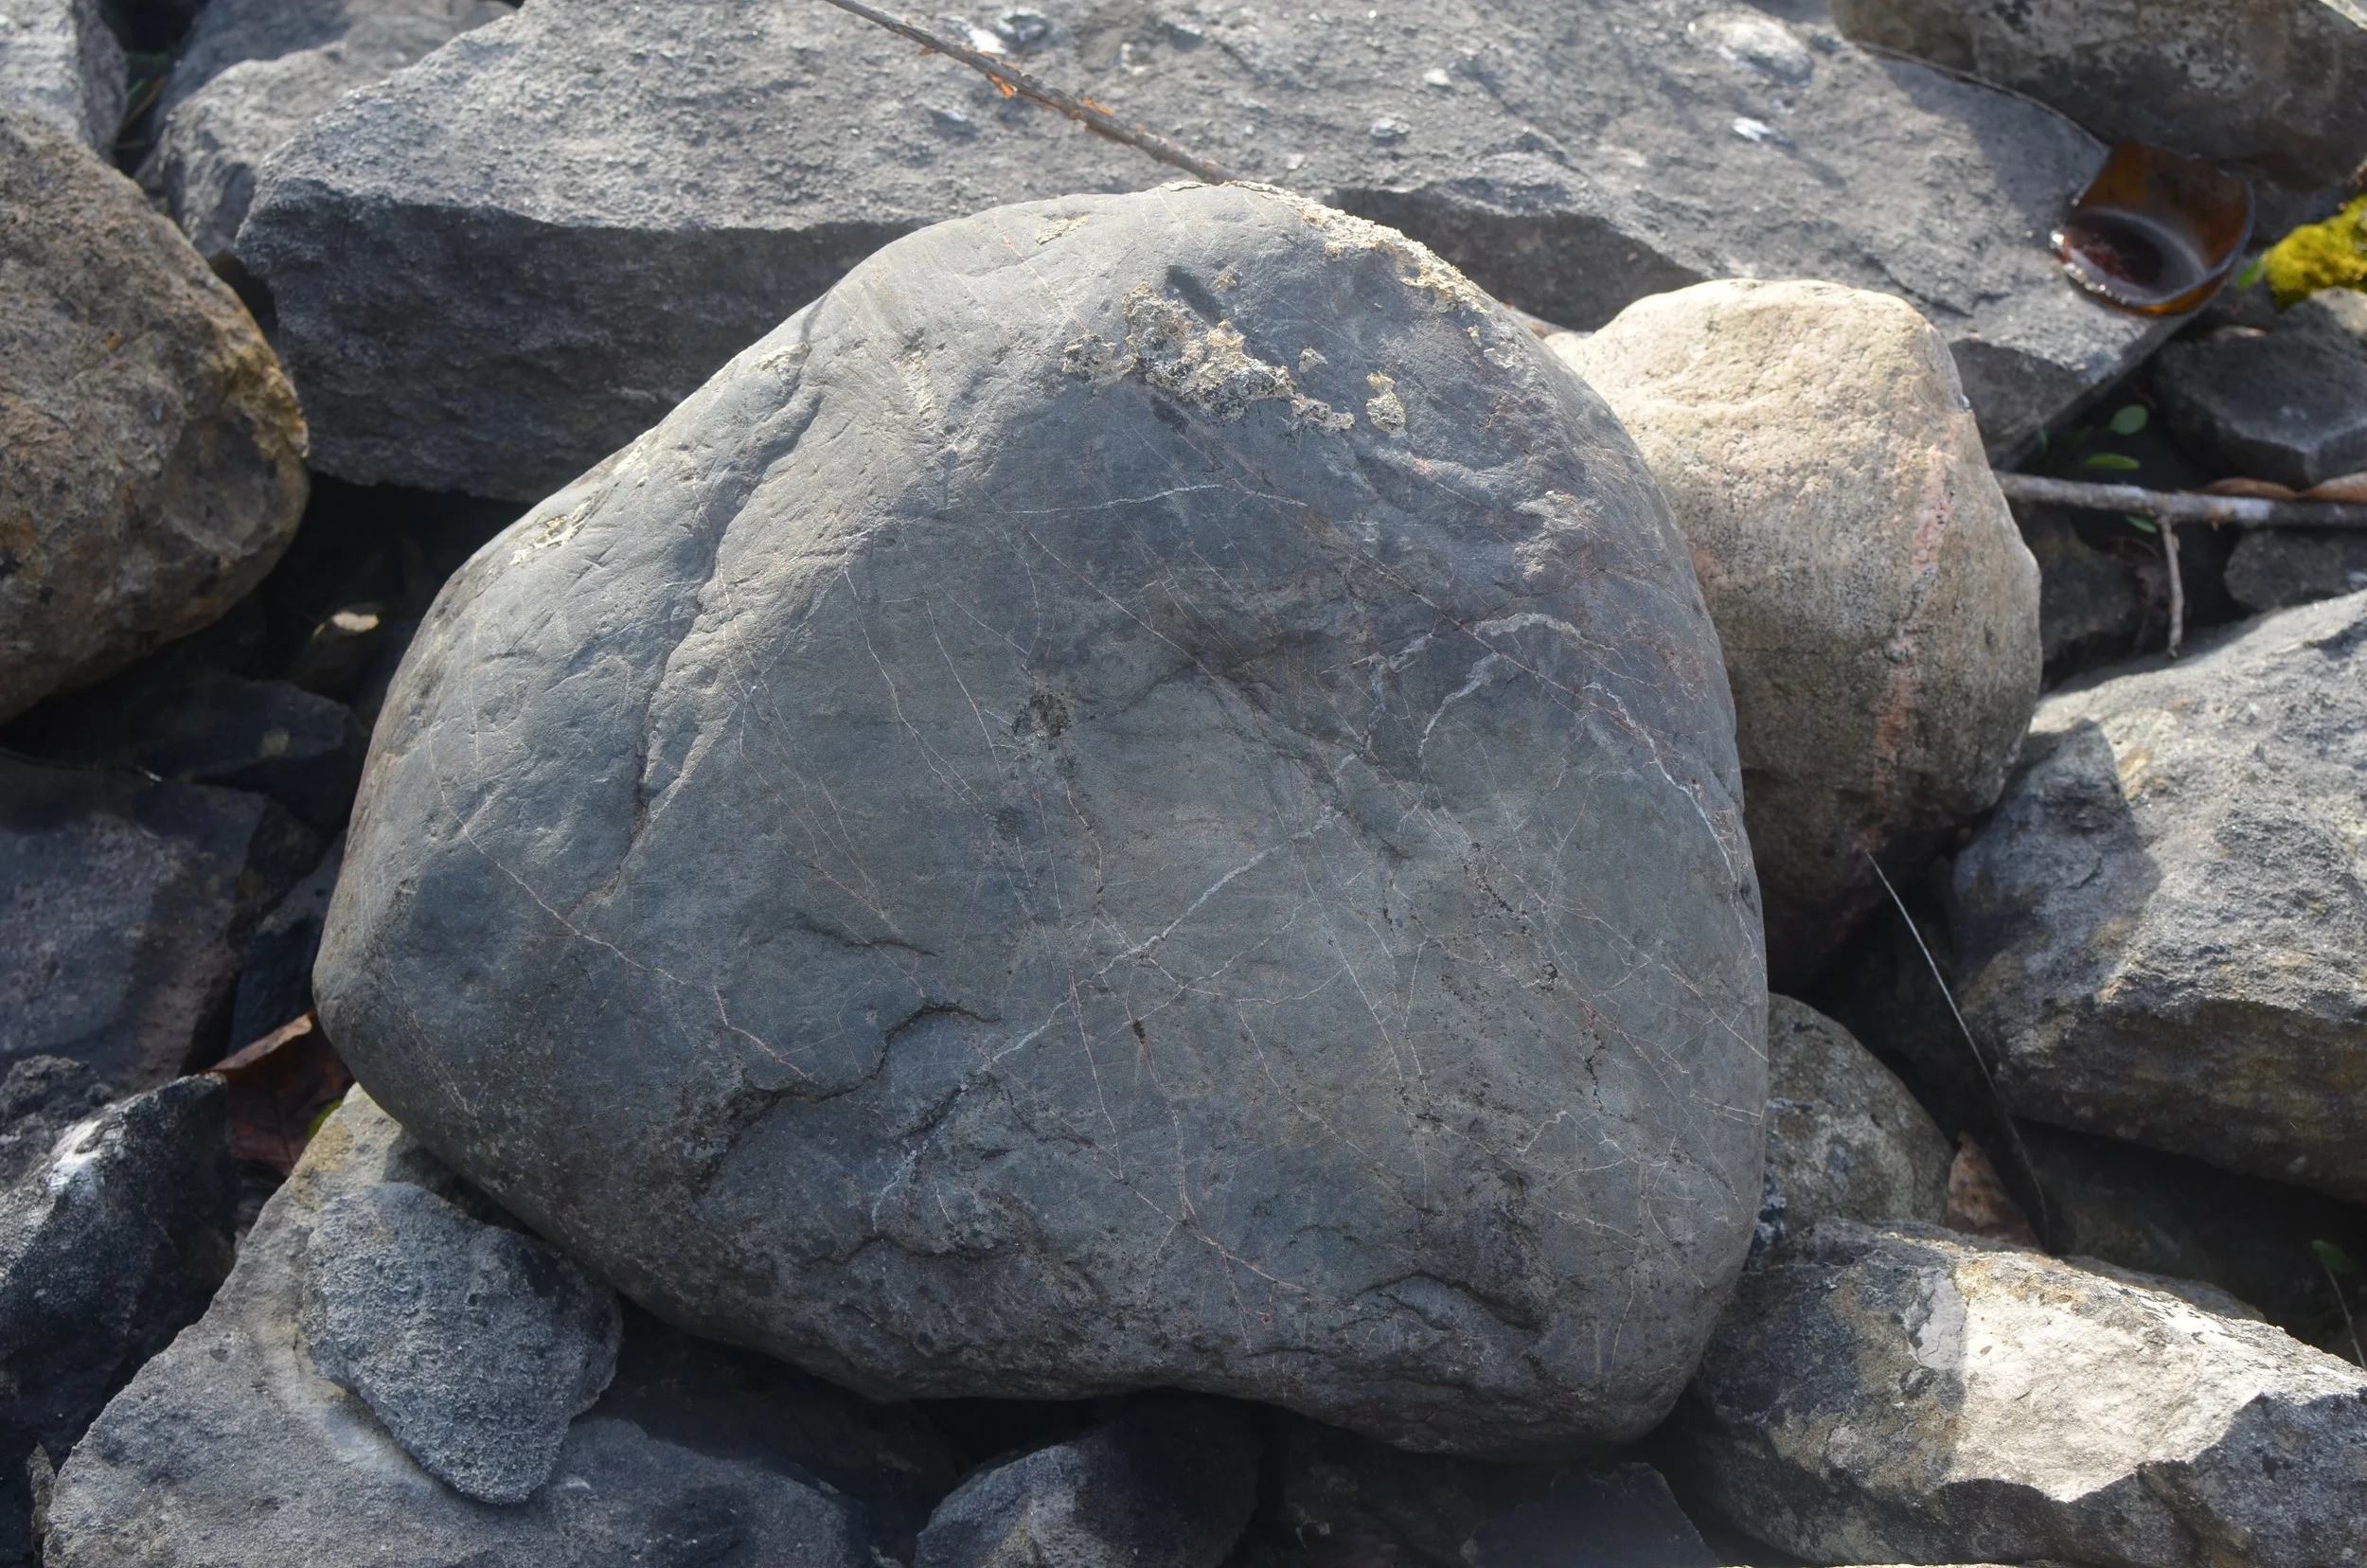
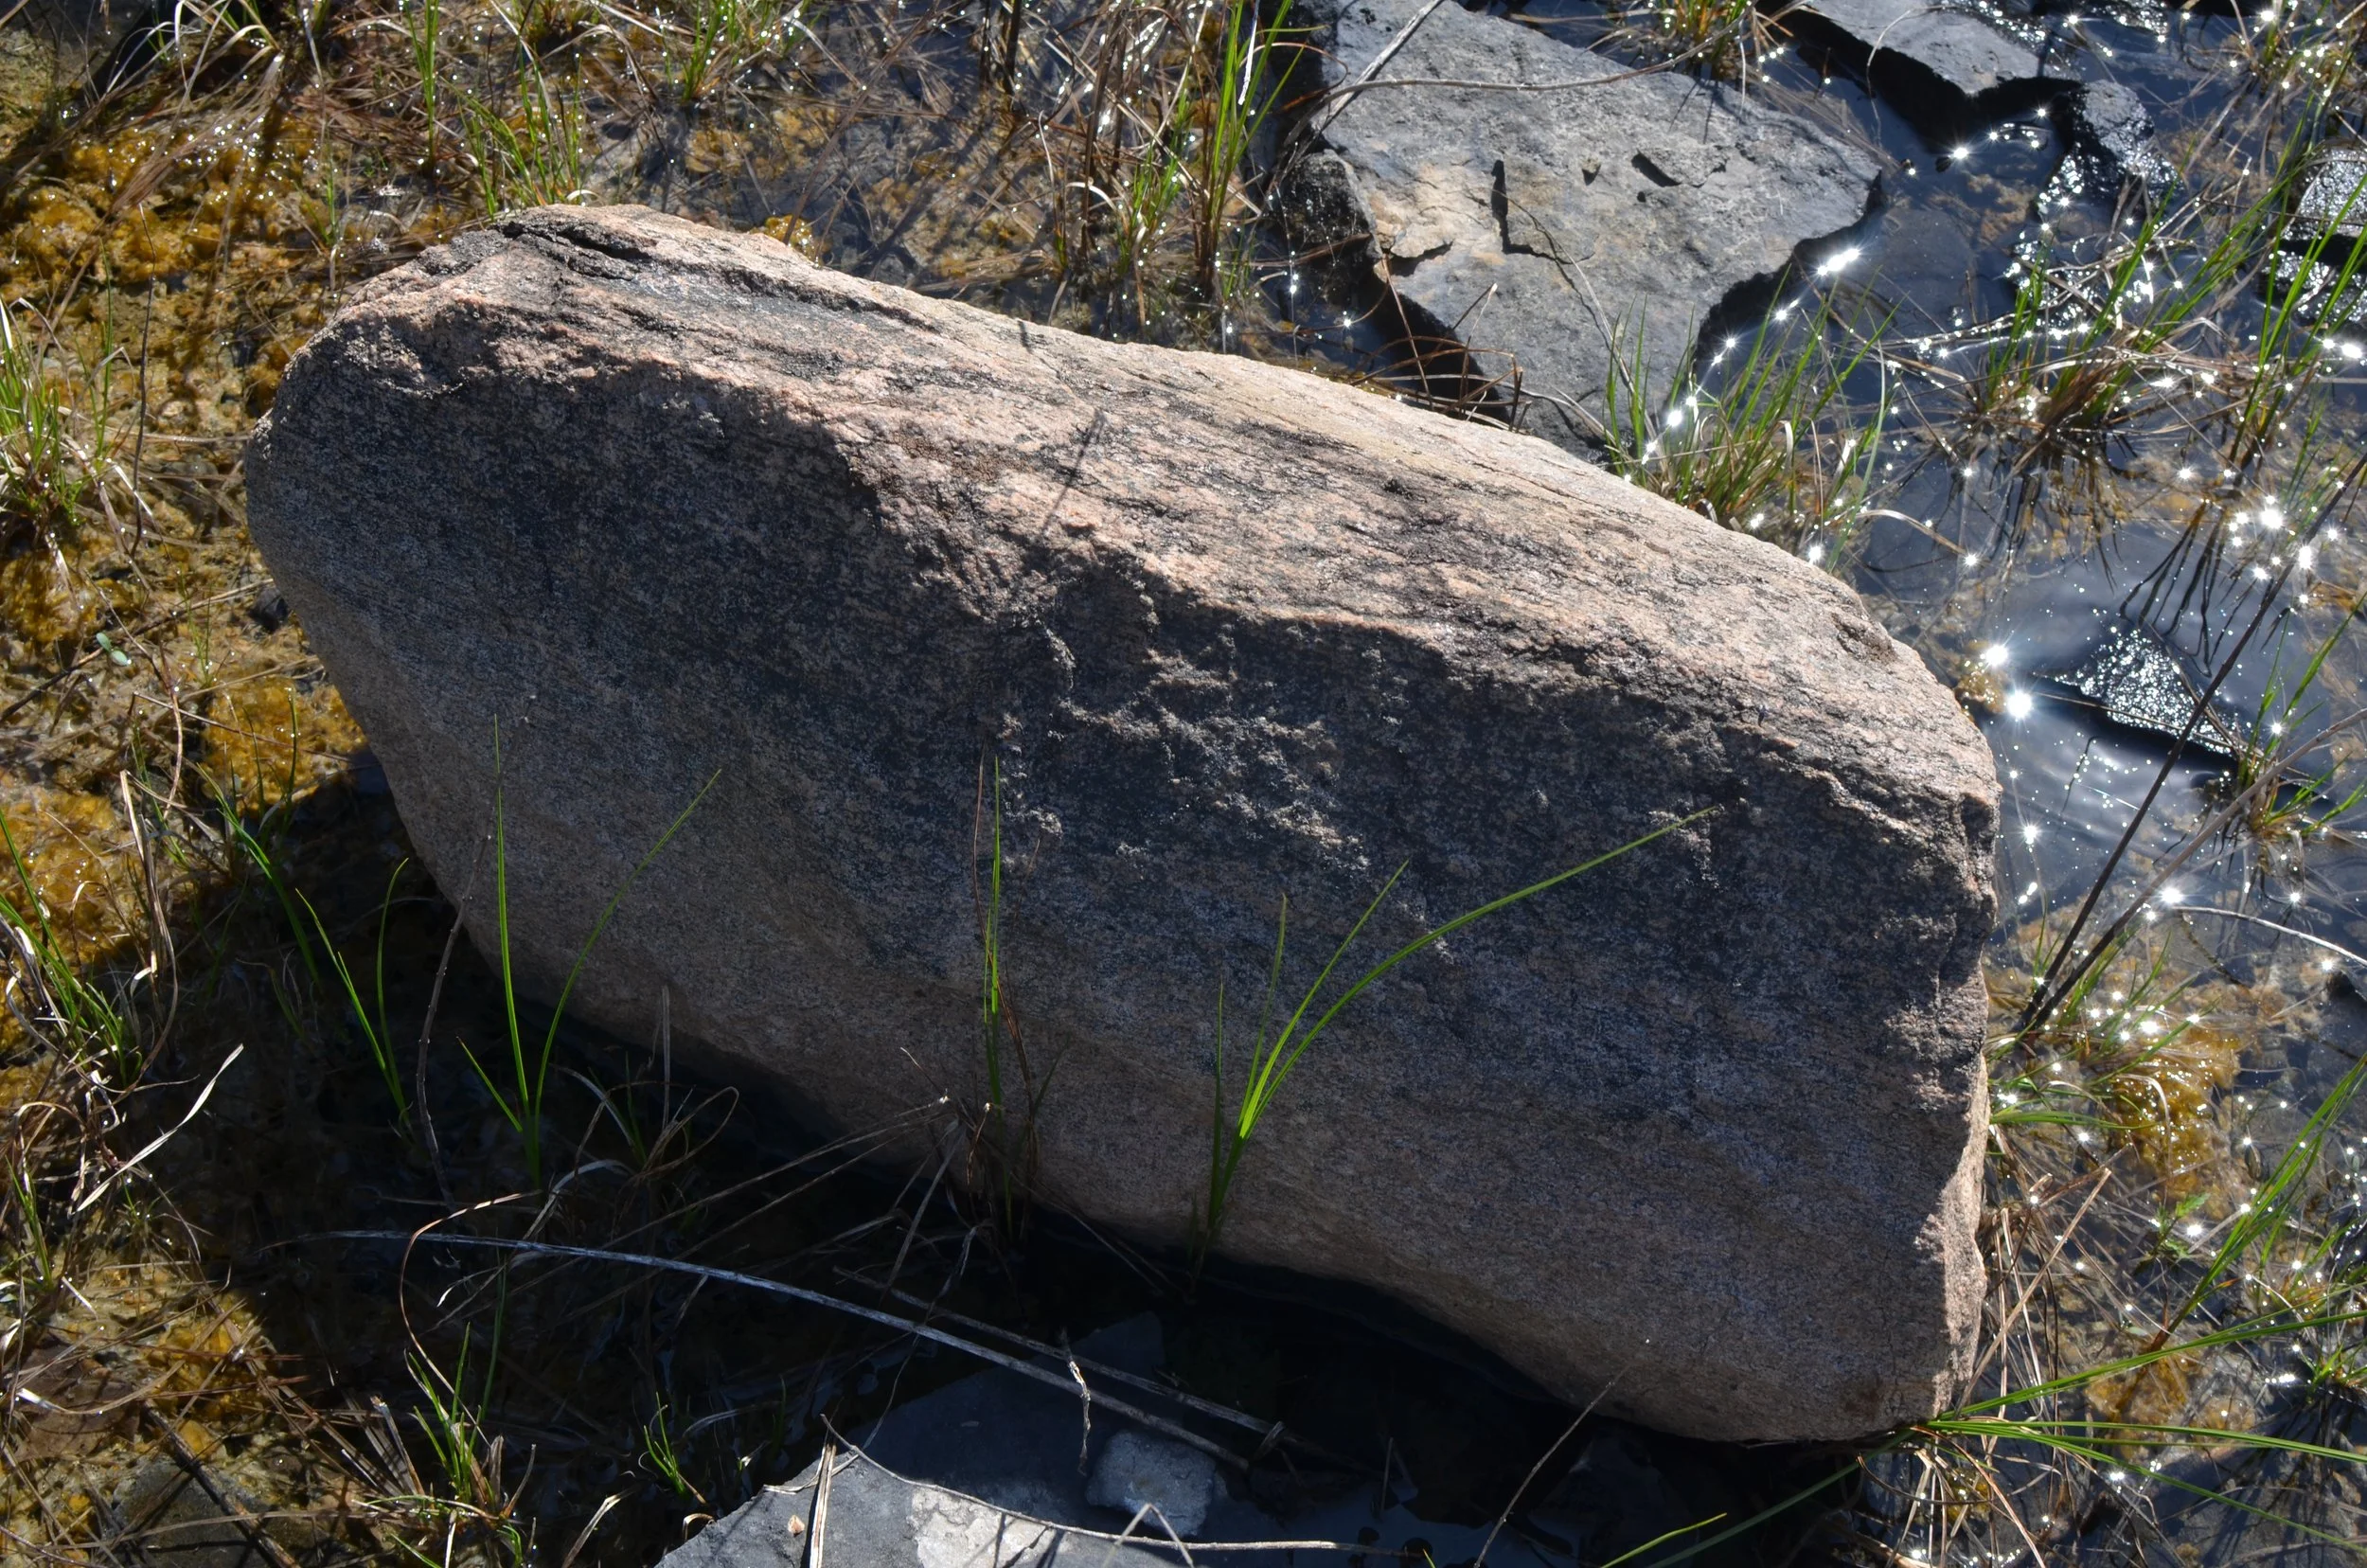
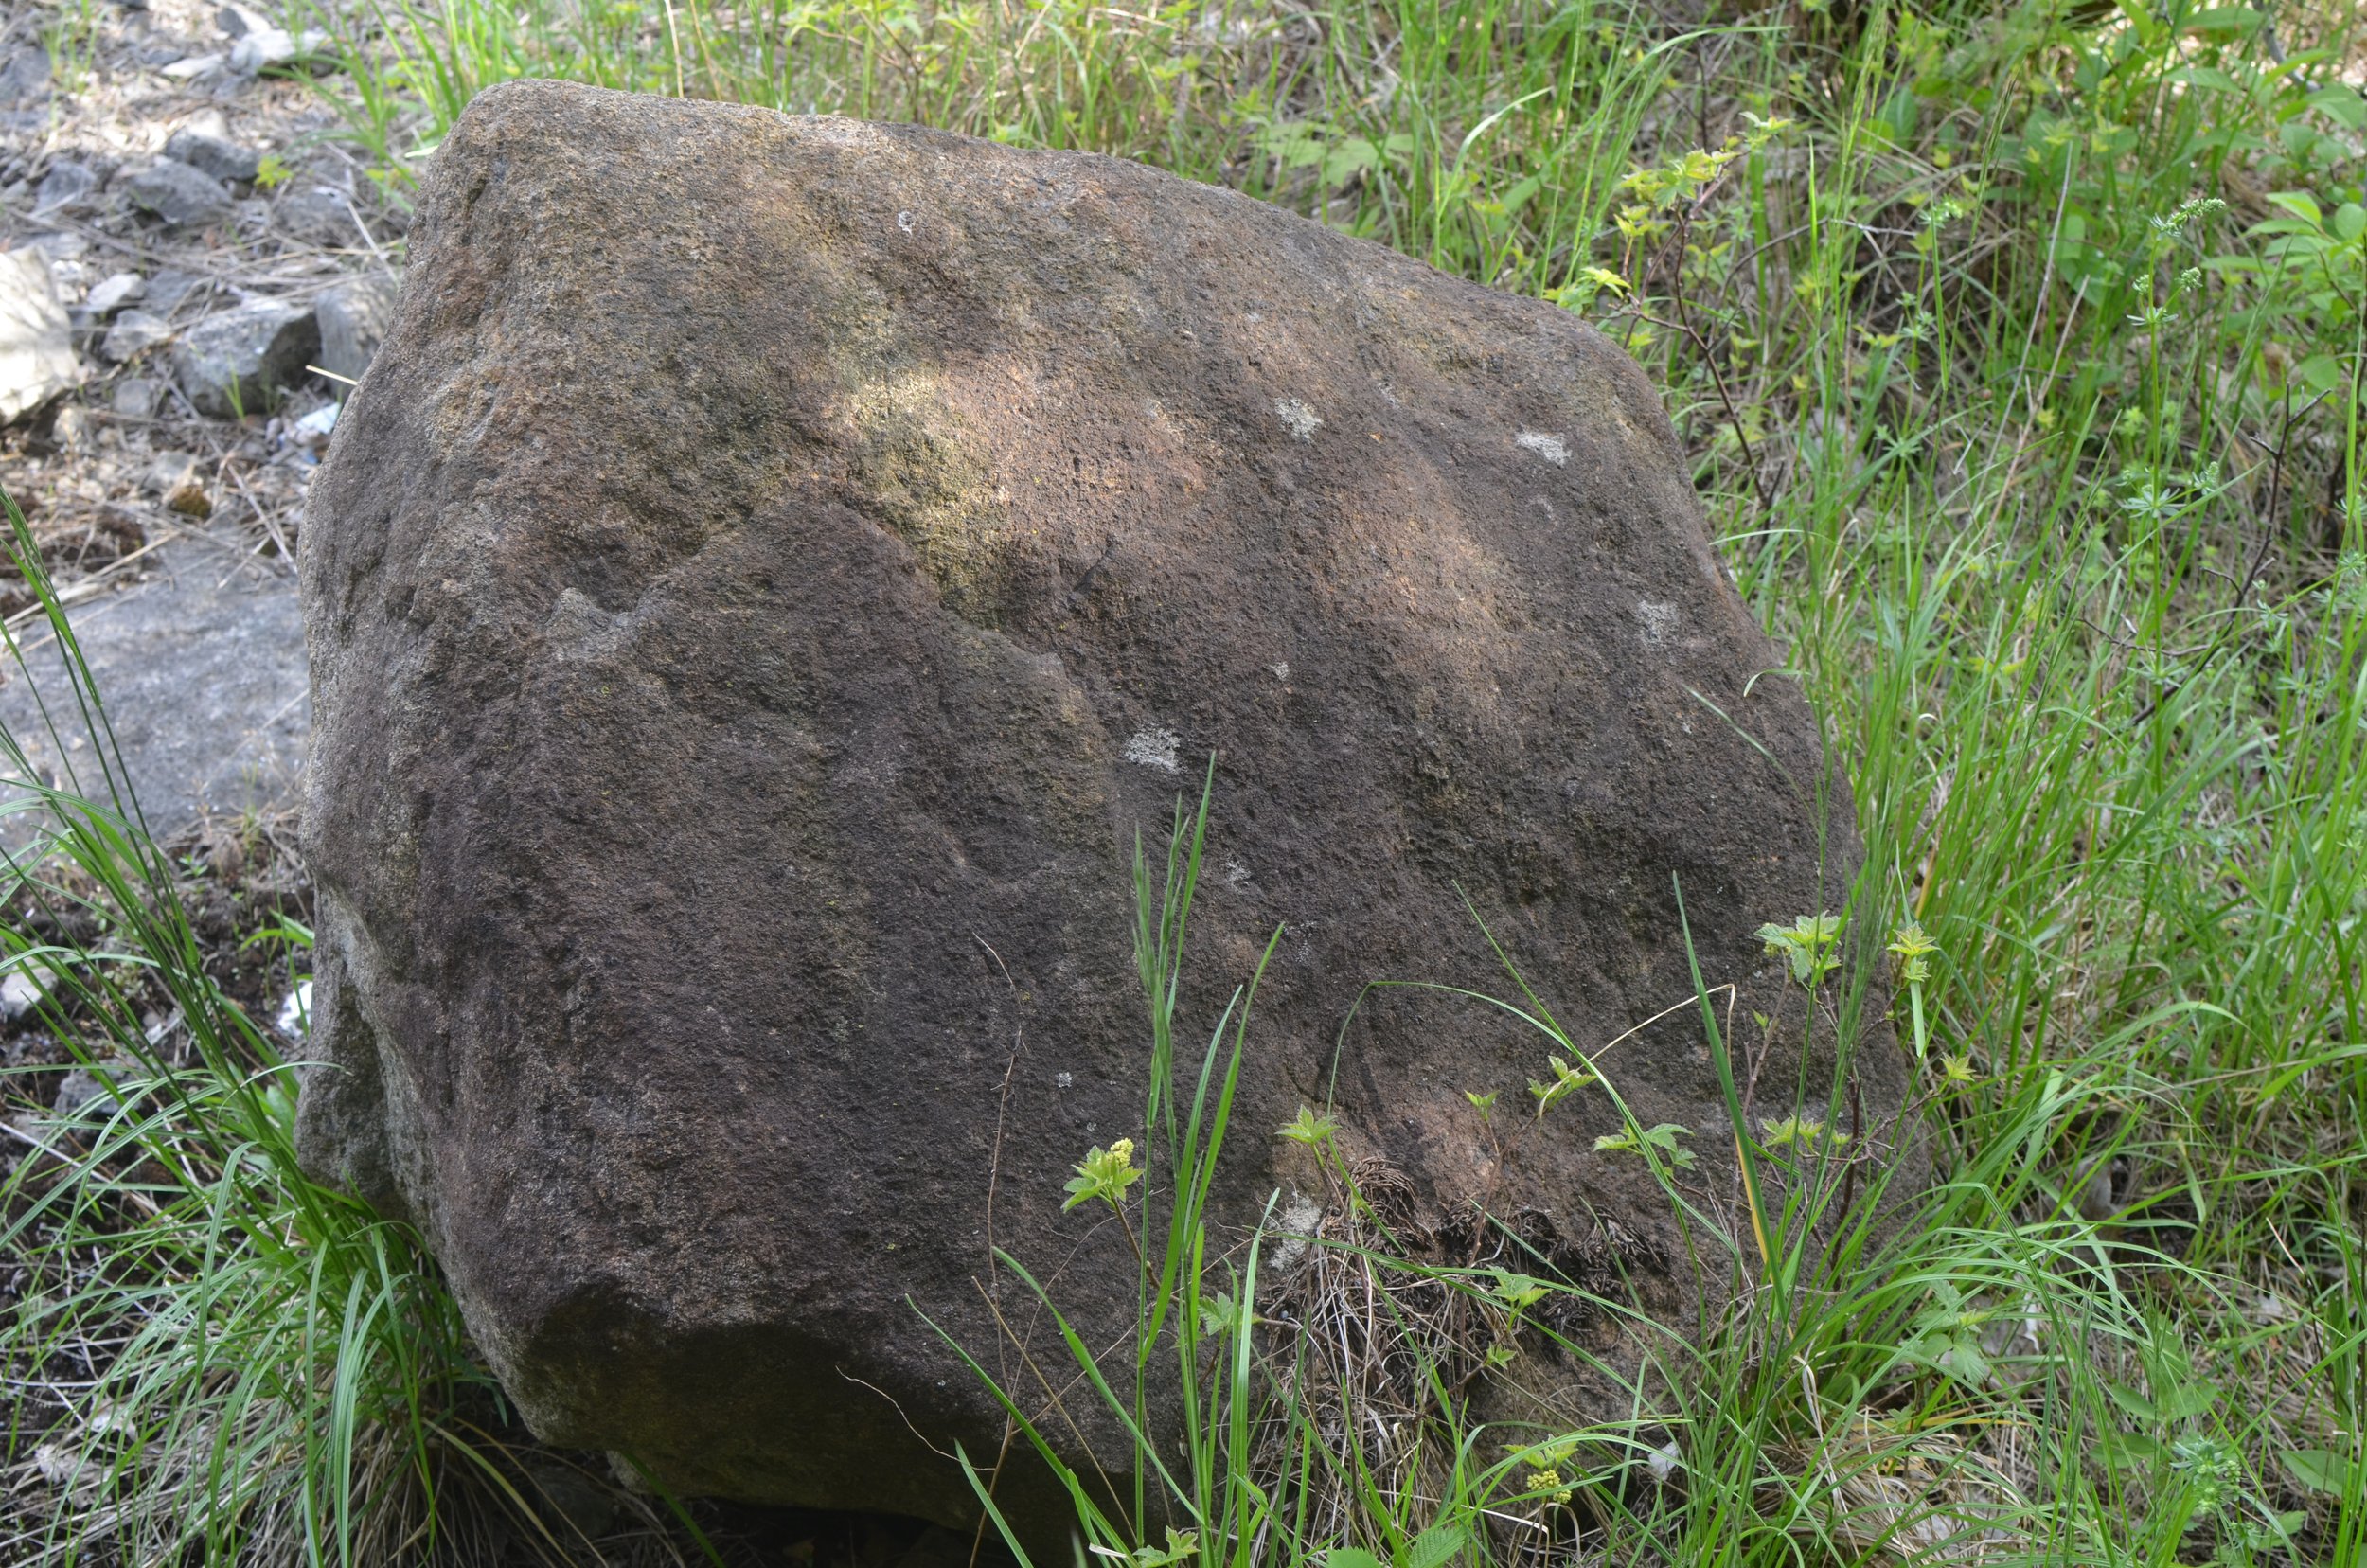
A selection of images from the complete dataset of 542 stones are presented below:
Compared to the fragments of blasted limestone, the 542 glacial stones scattered throughout the quarry became visible by not fitting in. These rounded stones emerged as figures against a background of angular, gray, blasted stone. The kind of difference your eye catches before you know why.
To visualize the set as a whole, I layered the glacial stone images and derived their standard deviation, average form, and full-stack composites. This does not document the visual characteristics of the stones, but instead reveals what kind of form emerges across a set, morphologically. This is what a category looks like from within. What the eye might be tuned to when it pauses. Not the individual stones, but the structure across the set of individuals.
Composite Statistical Image Analysis
revealing prototype structure in the dataset of glacial stones

Standard Deviation
This visualizes variability in the dataset. Edges with high deviation = areas of greatest morphological difference across stones. The value here comes from the anomalies revealed between the shapes of individual stones.
Average of all glacial Stones
This shows the mean morphology, the "statistical body" of the stone group. It suggests a baseline or archetype of glacial debris within this site. The set of images produces value by establishing a signature form for the stones, potentially derived from a dominant process in the glacial flow.


Stack Mode
This emphasizes shared structural features or recurring silhouettes across the set. The value here is the capture of latent “shape memory” across the debris, extending the average to potentially index the erosion logic during glacial transport.
To interpret how glacial stones were handled within the extraction landscape, I constructed spatial data layers in both ArcGIS and QGIS, linking standardized imagery with detailed attribute metadata. These navigable maps allowed for dynamic exploration of the site and enabled the generation of heat maps that revealed density concentrations of glacial erratics. Through this spatial analysis, I identified potential movement patterns and staging zones, which in turn helped infer the phases of quarrying operations. The visual and data-driven outputs provided insight into how material was sorted, relocated, or discarded over time.
Spatial Analysis in GIS
plotting stone data to identify concentrations of glacial stones
A TestBed for Ops Insight
This Glacial Stone Inventory provides a testbed for building future-facing tools. By treating erratics as indexical artifacts of both glacial transport and industrial sorting, this work establishes a framework for training systems to recognize, classify, and act on stone morphology in context.
This type of data can directly inform:
Ontology tuning for image classification systems in edge-case domains
Triage protocols for agricultural field clearing and geomorphic restoration & remediation
ISRU analog modeling for off-planet surface material sorting
Decision frameworks in post-industrial site reclamation
If you're developing adaptive systems, training data for automated sorting, or seeking grounded intelligence from complex landscapes, let's talk. This project is built for transfer.